
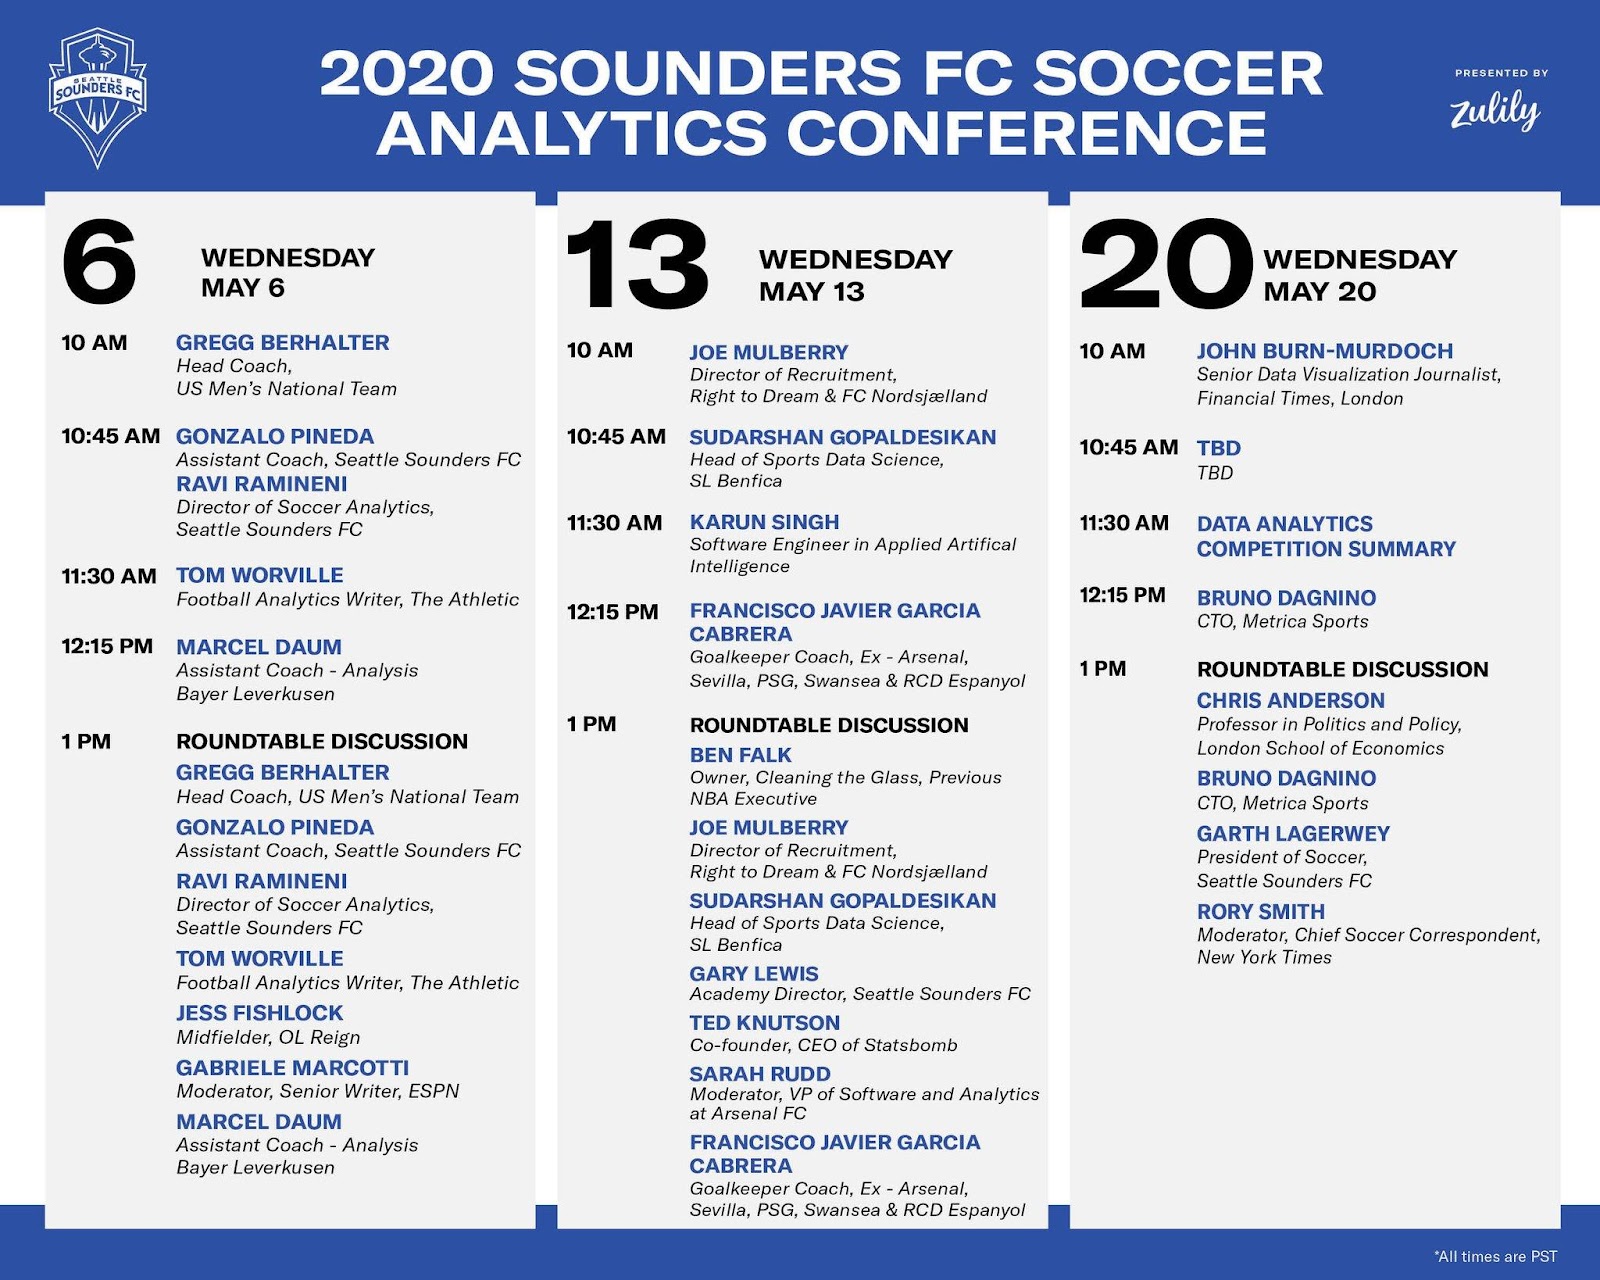
Sounders FC Soccer Analytics Conference
2020 Sounders FC Analytics Conference #SSFCAnalytics2020
By Daniel Krueger
Check him out on: Twitter, Github, Linkedin
Day 1
- Gregg Berhalter – Head Coach, US Men’s National Team @USMNT
- What are the key ingredients of a high performing relationship between the coaching staff and the analytics department?
- People, communication, trust, feedback, collaboration and respect
- Player scouting/journey
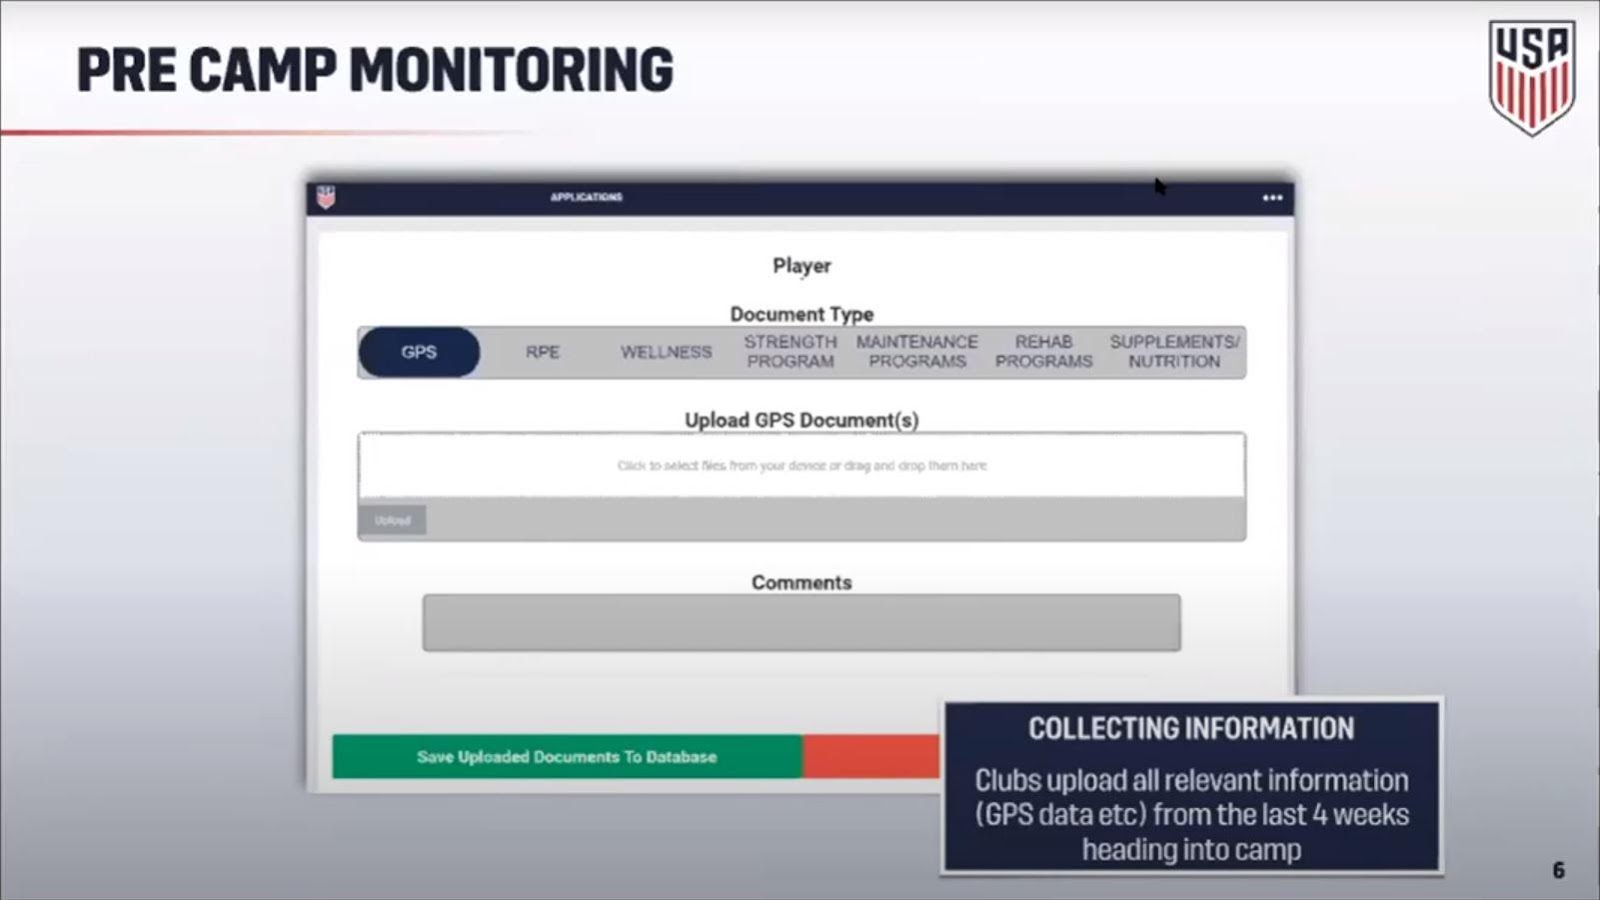
- Player arrival
- All materials for each individual player into dropbox
- Clubs send all relevant information from last 4 weeks heading into camp
- Player load monitored during and RPE after training
- Understanding chronic load and travel
- All materials for each individual player into dropbox
- Training preparation
- All previous training sessions live in an archive
- Dropbox collaboration
- Full session library
- Activity library
- Training session load plan – high performance team
- Reducing training risk
- Training
- Filmed from 2 angles
- Live coding
- Activity reps
- Principles of play
- Effectiveness of training
- Filmed from 2 angles
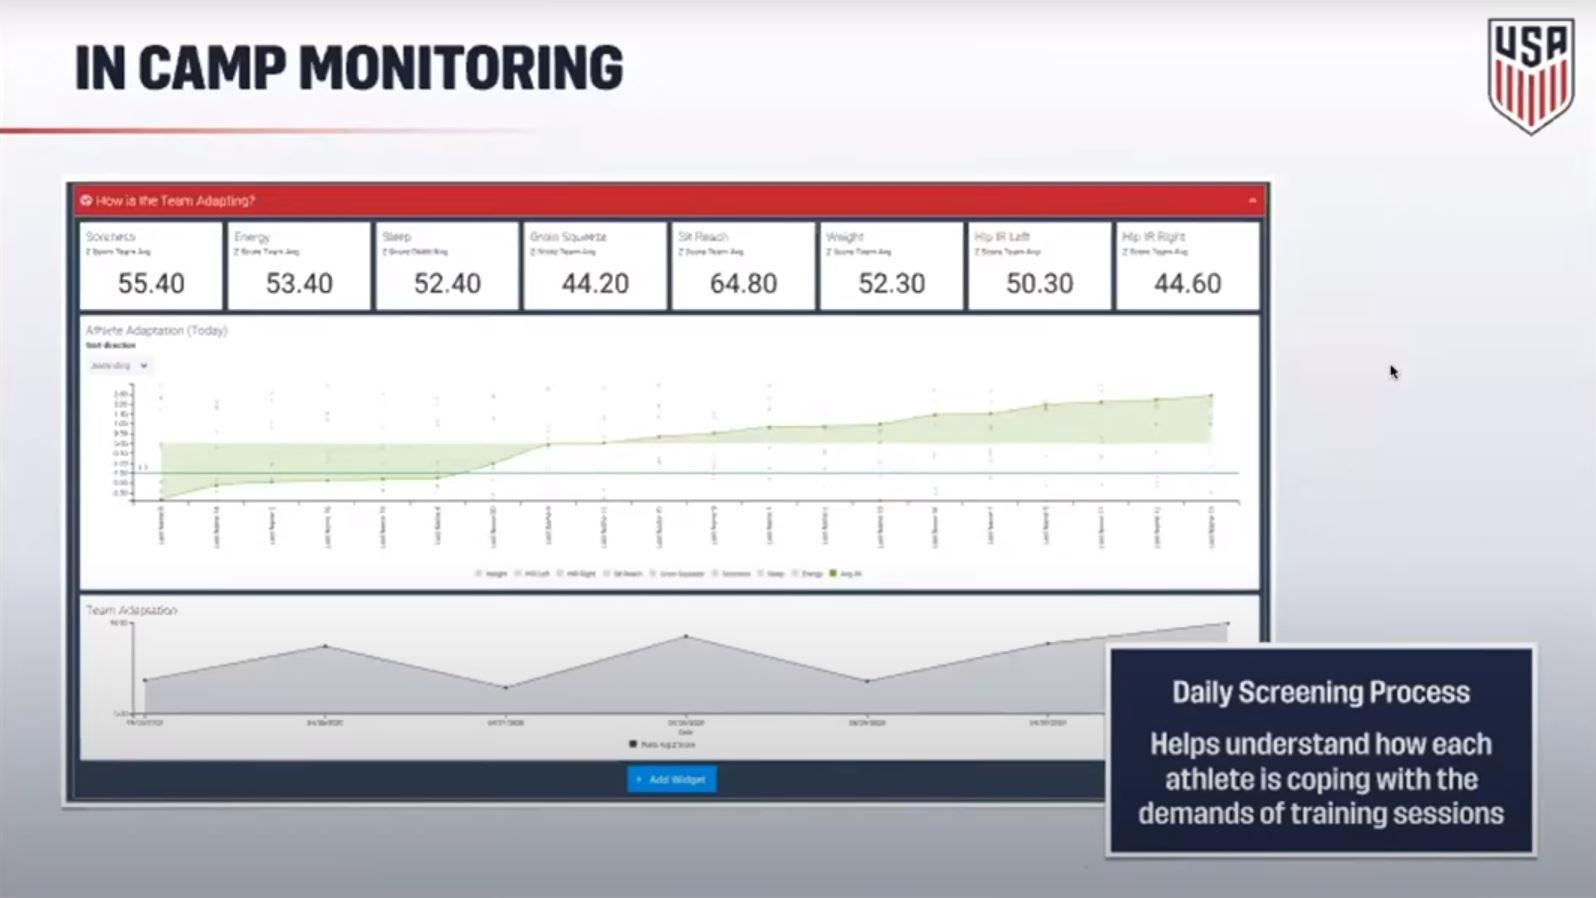
- In camp monitoring
- In camp training load reports in comparison to club load reports
- How is the player’s body coping with the demands of the training session
- Daily screening process
- Player surveying
- Daily screening process
- All previous training sessions live in an archive
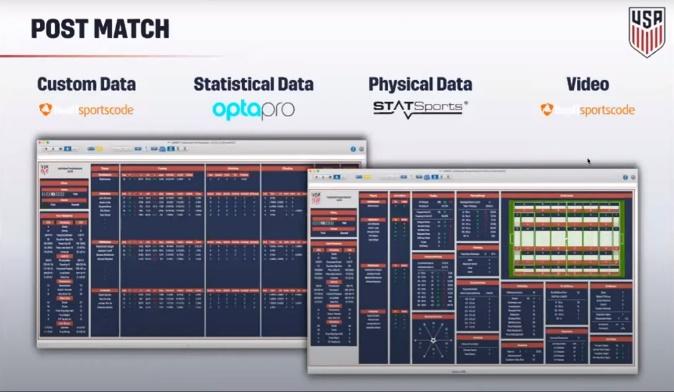
- Match day
- Opponent scouting
- Wide angle sharing network
- Opta data integration
- Tactical and individual output reports
- Top level trend reports
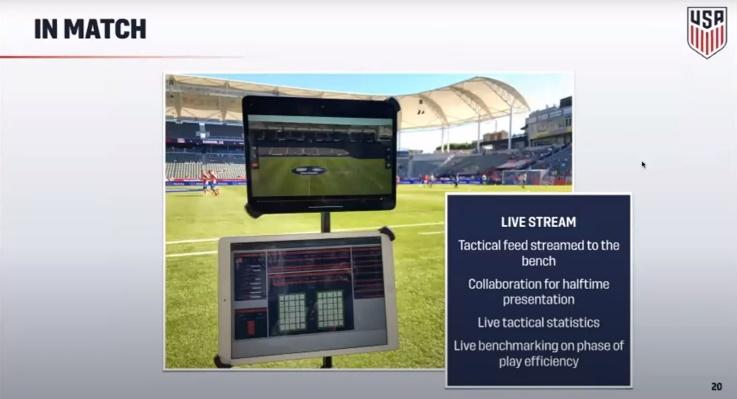
- In match
- Live tactical stream to bench
- Post-match
- Internal benchmarking
- Style of play validation vs outcome focused
- External benchmarking
- Where are we in relation to progression of comparable international teams?
- “In the world of soccer, we match up as a tier 2 team” – Berhalter
- Principle of play database
- Creation of playbooks for USMNT style
- Internal benchmarking
- Opponent scouting
- Player Departure
- Post camp
- Data being sent from USMNT to the clubs within 24 hours
- Information and recommendations for reintegration into the club
- Post camp
- How do we get better?
- High pressing
- Developing alternative defensive structure
- Shooting zones / low block defending
- Where the goals are scored
- Set play analysis
- Attacking set plays
- Offensive transitions from defending restarts
- Throw-ins
- Best practices
- Learning from international & club level best practices
- High pressing
- USNT structure- high performance and analytics all work in the same office
- All working towards the same goal
- How can we get the most out of our players by setting up data?
- Challenges
- How are we continually growing?
- All working towards the same goal
- Trusting instinct as a coach vs data
- Use data to HELP us make decisions
- Instincts are important
- High performance team telling us something about a player’s work load
- We went into the Gold Cup semi with 2 subs we were planning to make at halftime based on the data available
- Passing networks
- Opponents passing networks show us relationships between players
- Player arrival
Summary: US Soccer has been at the forefront of providing the soccer analytics community with best practices and strategic process during the Covid-19 pandemic. Definitely check out the 8 part webinar series put together by US Soccer’s Director of High Performance James Bunce, which walks participants through US Soccer’s elite athlete monitoring and high performance infrastructure. From pre camp monitoring to post match evaluation, Berhalter’s talk walked attendees through the extensive data collection and integration processes that exist within the US Soccer high performance. US Soccer coaches receive data live streamed to the sidelines during games. “We are able to see video live on the bench, which allows our staff to tag and prepare our own halftime folder for review with the players.” USMNT General Manager Earnie Stewart hired Berhalter through a process that was defined by analytics, and this talk certainly backed up Berhalter’s acceptance of analytics as a key ingredient in his coaching process.
- Ravi Ramineni @analysefooty – Director of Soccer Analytics, Seattle Sounders FC @SoundersFC
- Gonzalo Pineda @GonzoPineda8 – Assistant Coach, Seattle Sounders FC @SoundersFC
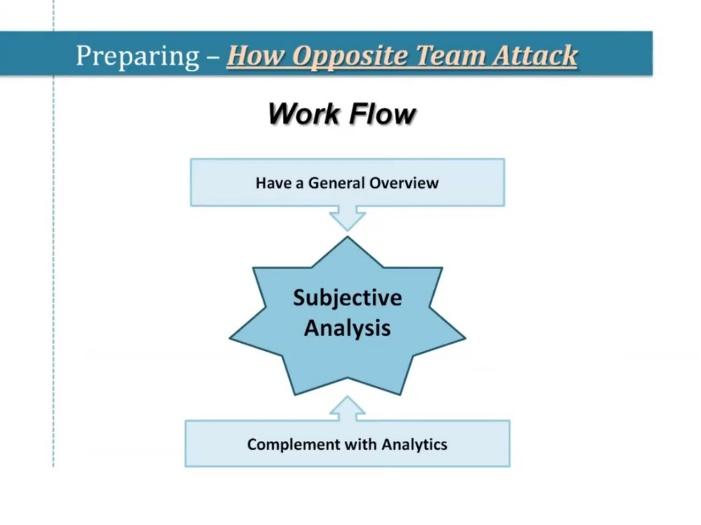
- Coach vs analyst
- Subjective vs objective
- Is data always objective?
- Interpretation of data adds subjectivity to the mix
- Is data always objective?
- Complementary relationship
- Subjective vs objective
- Evaluating performance
- Evaluate our own performance
- Analyze opponents
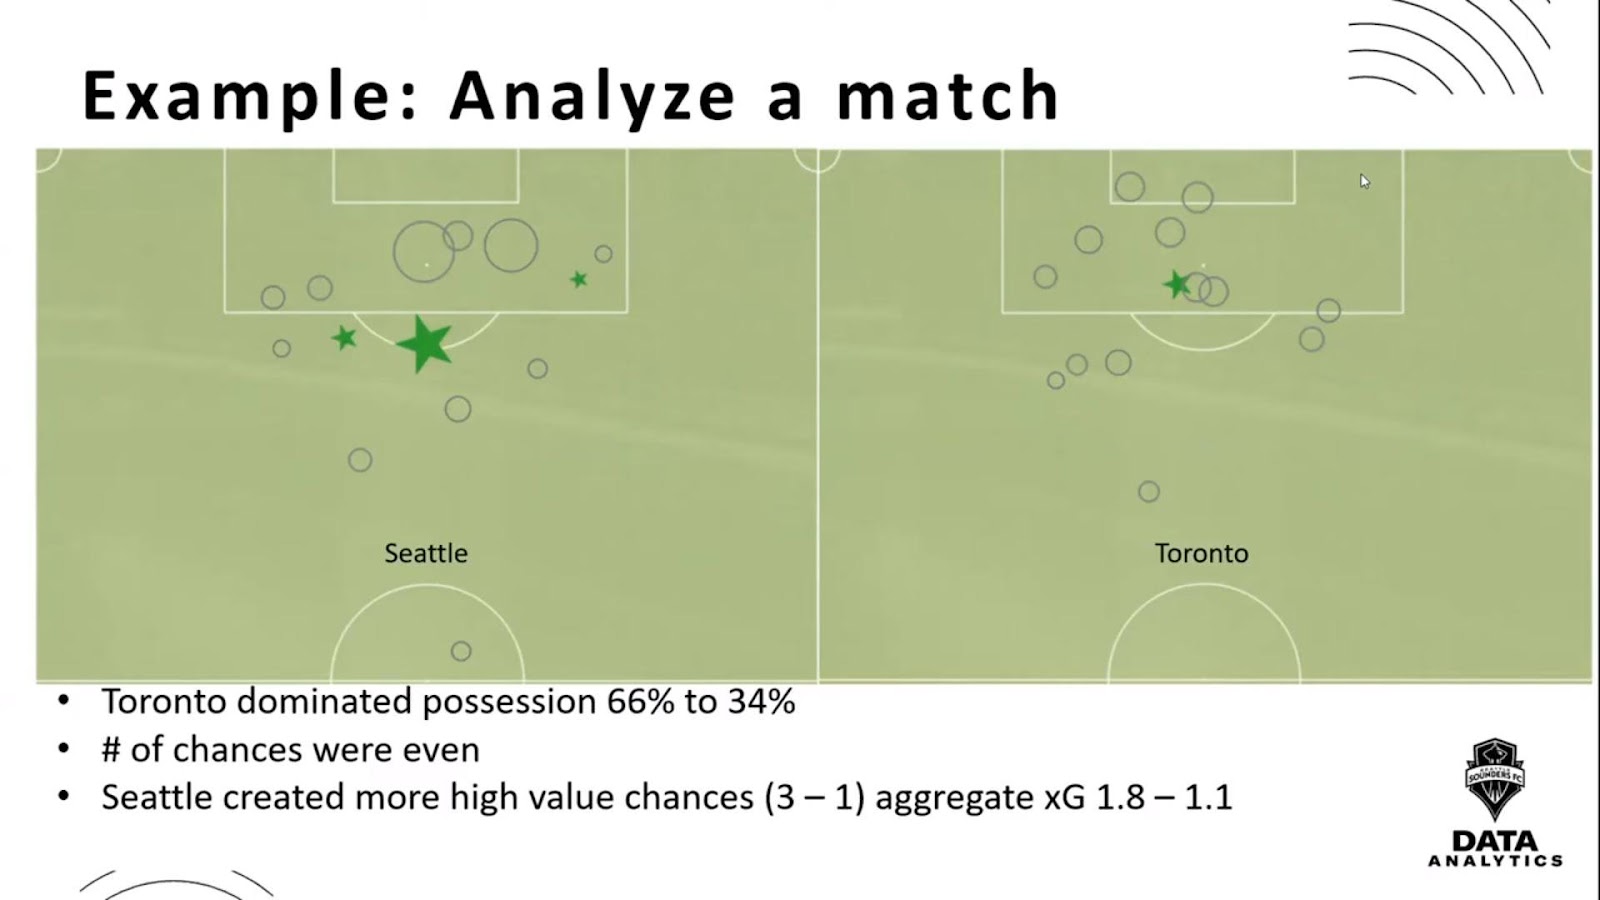
- Example – Analyze a match
- Analyze an opponent
- Using video in conjunction with data to analyze opponents
- Heat maps
- Using video in conjunction with data to analyze opponents
- Scouting players
- Raul Ruidiaz example
- FC Bayern
- Trying to build out of the back
- Player awareness
- Can I progress the ball?
- Vidal missing a ball progression opportunity by playing back
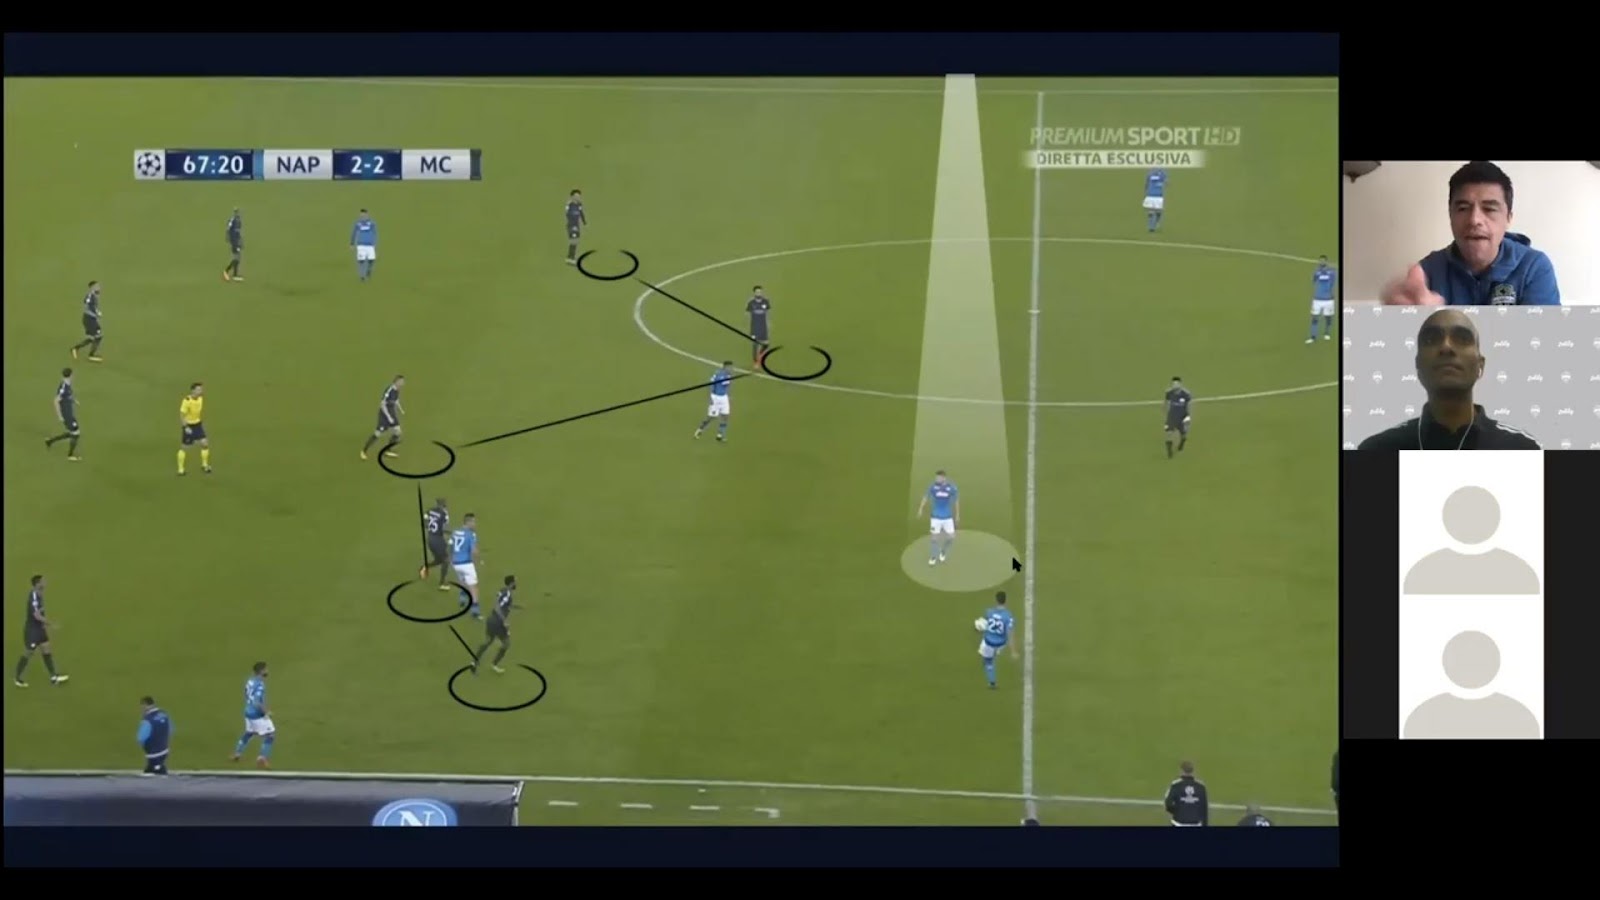
- Napoli
- Head movement before ball received to understand space
- Hamshik to Mertens to Callejón
- Head movement before ball received to understand space
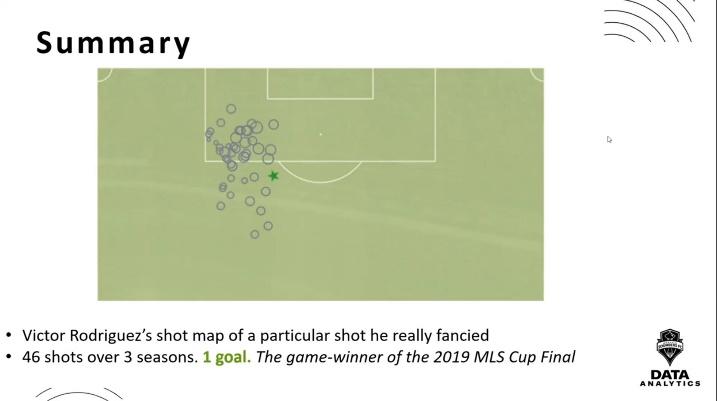
- Whether or not we should let players take shots with low probability
- Victor Rodriguez shot map example
- Coach vs analyst
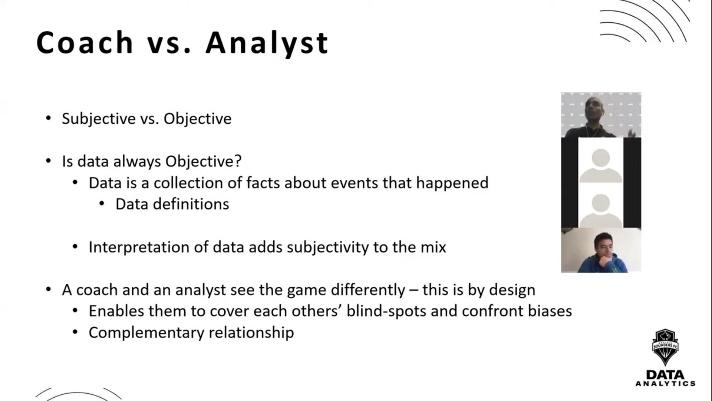
Summary: Ramineni and Pineda switched gears to give attendees insight into a club’s in-house analytical process. There were some differences, but also many similarities between the USMNT analytical approach and the approach taken by the Sounders. Both groups referenced that though both exist independently, the collaboration with national team and club analysts is extremely important when evaluating player fatigue and capacity. The idea of coach and analyst coexisting with a complementary relationship was introduced (this was a common theme throughout the conference) in this presentation. A strong relationship between the coaching staff and analytic staff enables each staff member to cover each other’s blind spots and confront biases.
“The key part of this connection – not confrontation – between coach’s and analyst’s point of view is that one fills the gap of the other. There is data that complements the point of view of the coach, but also presents a challenge for coach and analyst to get more meaningful data.” – Gonzalo Pineda
- Tom Worville @Worville – Football Analytics Writer, The Athletic @TheAthletic
- Analytics, a bite at a time
- Transition from Opta data scientist to data analyst to football analytics writer for The Athletic
- The Athletic
- Using data to tell stories
- Where is analytics going?
- The Athletic
- Not currently working at a club but…
- Internal club analyst and scout relationship similar to the relationship between Worvile and fellow Athletic writers
- Learning about players they have spoken with/see week in and out
- Questions what I think will work well vs what they know will work well
- Editors are my analogue to coaches
- Two sides of data in a club
- Decision makers – let’s use data to make decisions
- Data makers – data is fallible
- Two sides of data in a club
- “There is only one way to eat an elephant: a bite at a time”
- Analogy for adoption of analytics
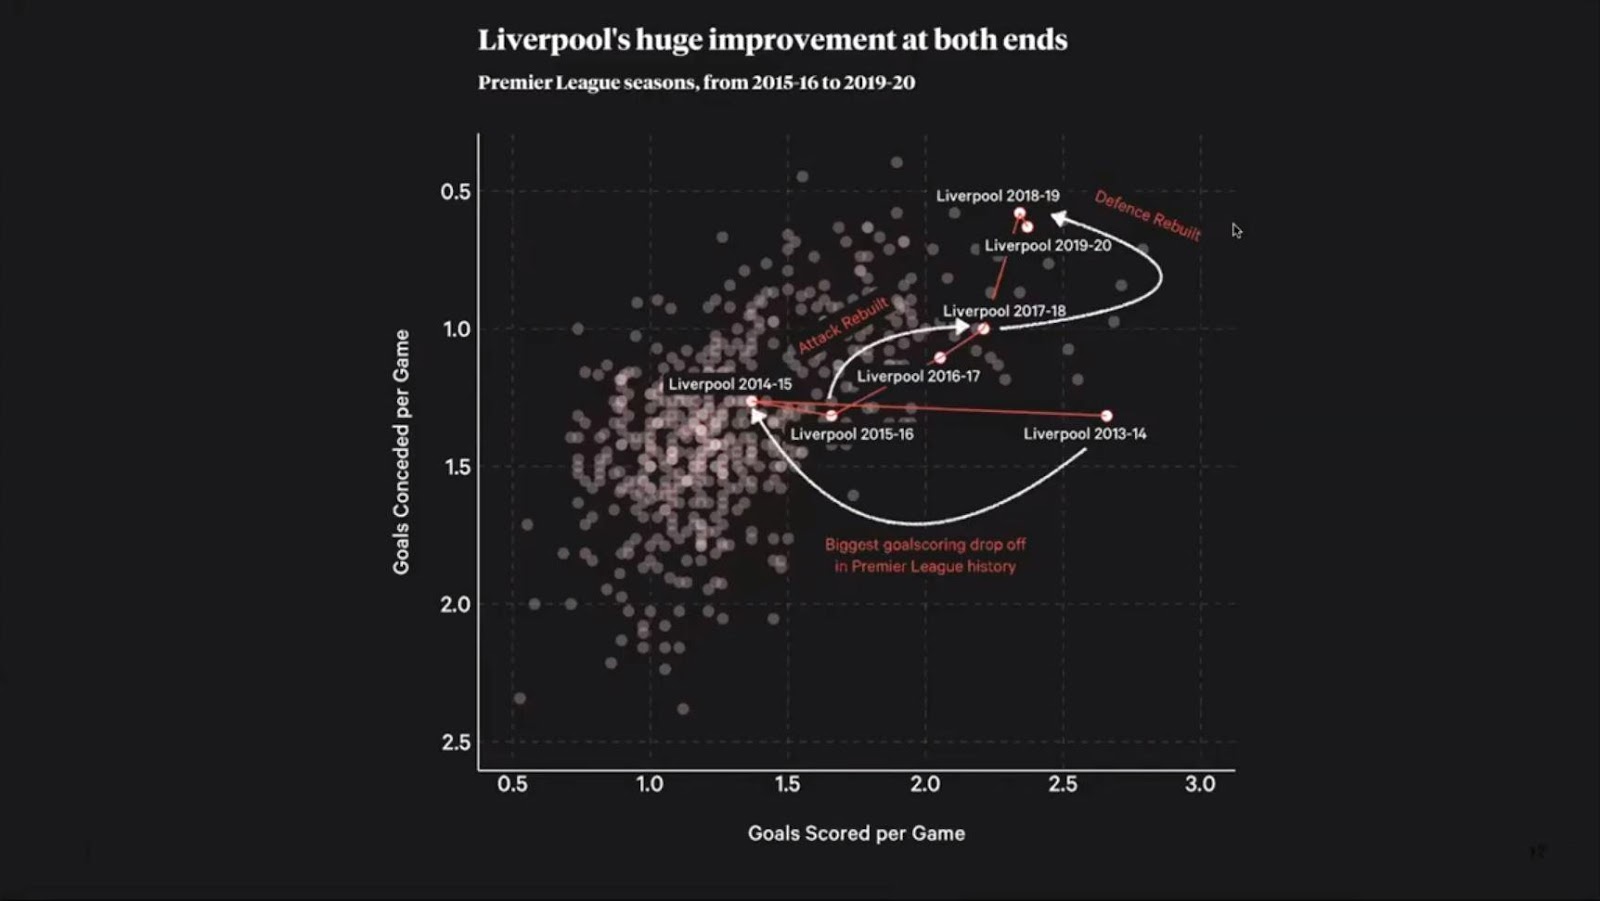
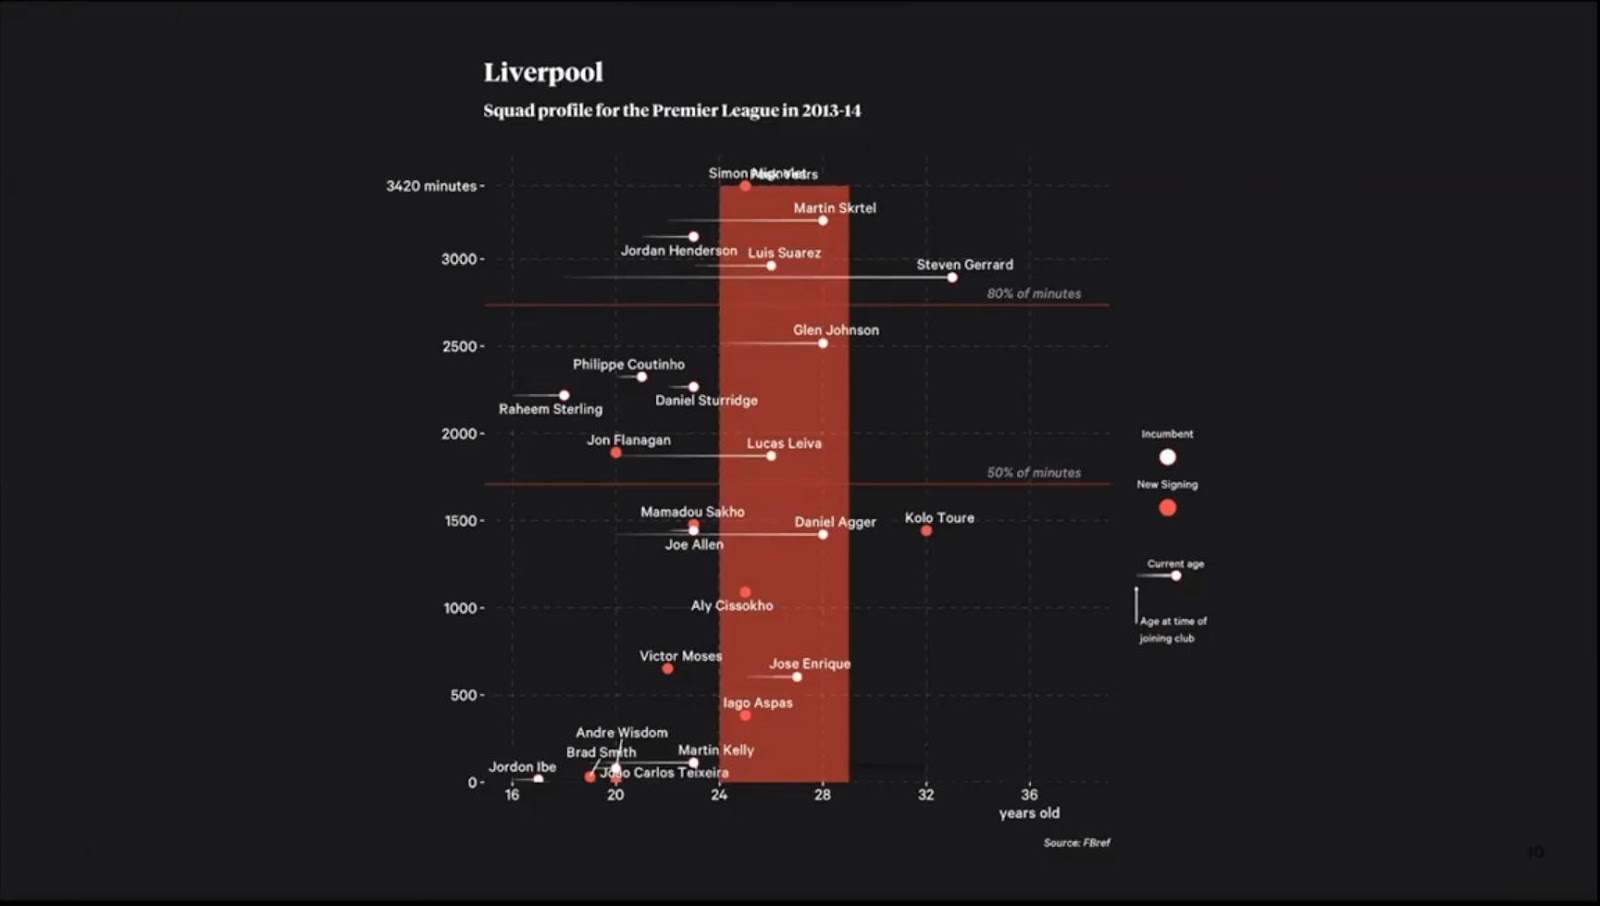
- Example: Liverpool
- Age profile
- Informational overload
- Skill is not in accumulation, but making sense of it
- Need to be fully trusting of data to make use of it
- Misleading metrics – Worville’s 10 Commandments of football analytics
- Passing the eye test
- Example of tackle win percentage as a misleading metric
- Hiring
- First hire shouldn’t be a data science
- Should be data engineer and/or analyst
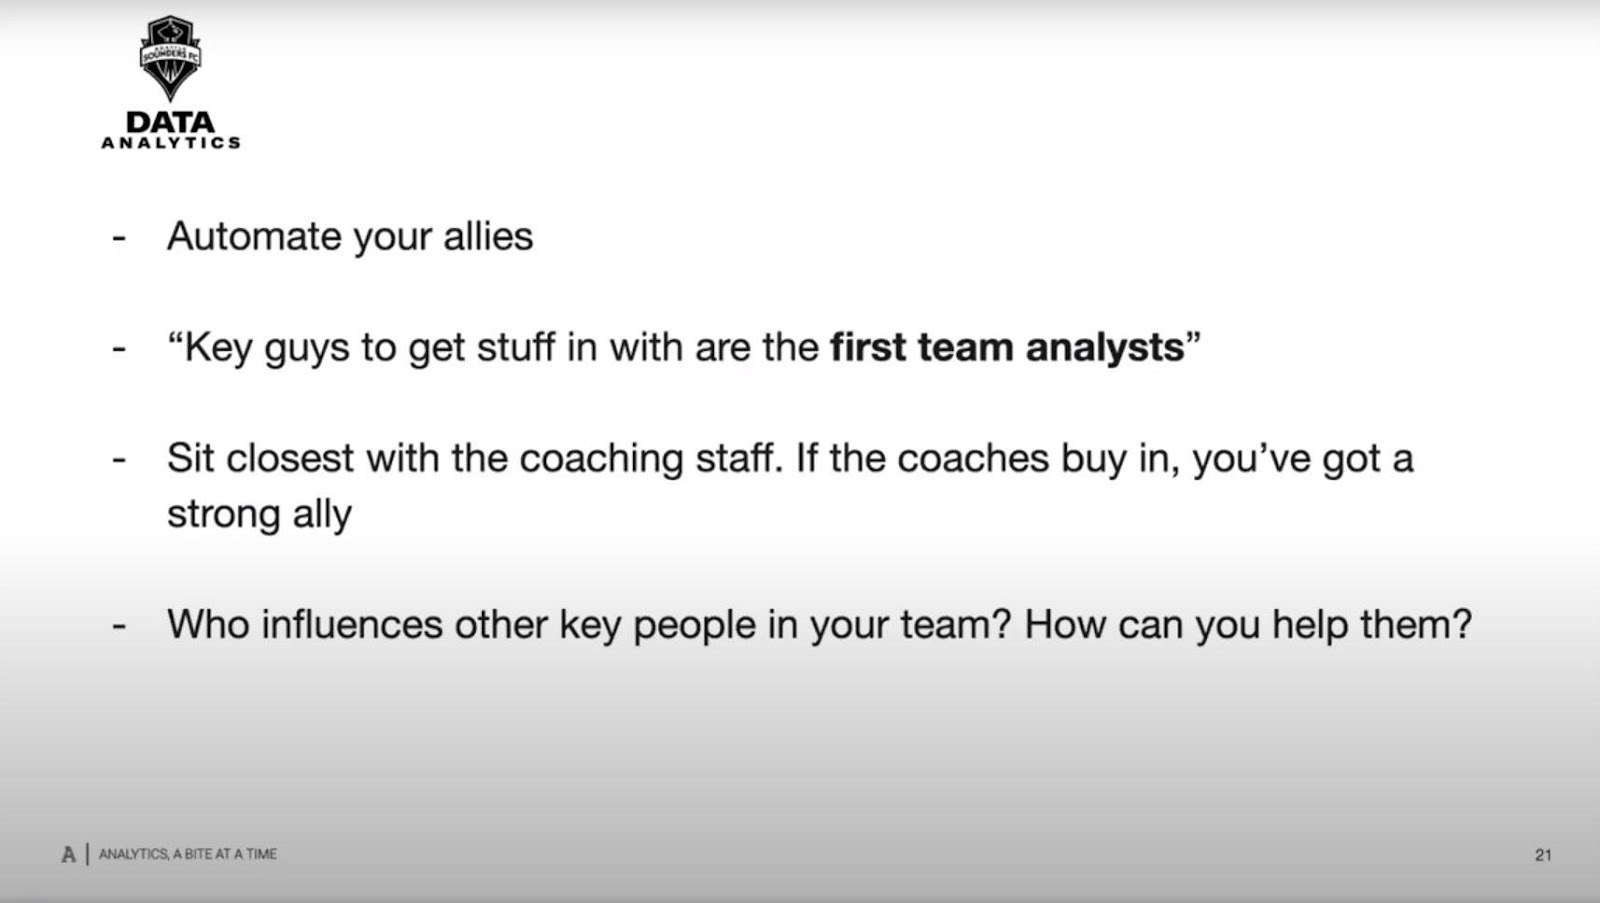
- Automate your allies
- Sit closest with the coaching staff. If the coaches buy in you’ve got a strong ally
- Who influences other key people in your team? How can you help them?
- Limitations at the moment
- Stats aren’t the definitive viewpoint
- Bad stats does not equal bad player
- We might not have the tools available to properly quantify a player’s role
- Need to provide context within team and player’s role
- Stats don’t measure everything
- Defensive metrics are largely stylistic and not a measure of quality
- Even if we are modeling with more complex data sets, subjective modeling decisions are inevitable
- Missing out on plenty of off-ball events that take place
- Bridging the gap with data visualization
- Start with the simple stuff, and go on a journey from there
- These are from USWNT reports
- Takes time to build up to this level of complexity
- Data visualization
- Art and data as one
- Tabular colored data creates identity
- Annotations are powerful
- Draws eye to important things to focus on
- Might be “slow” but can have a greater impact
- Art and data as one
- Book recommendations
- Super-forecasting the Art of Science and Prediction
- By Philip Tetlock and Dan Gardner
- Tanking to the Top
- By Yaron Weitzman
- Thinking in Bets
- By Annie Duke
- Super-forecasting the Art of Science and Prediction
Summary: Moving from Opta Pro, a soccer data company, to The Athletic, Worville was able to offer a unique perspective on the current state of soccer analytics. There was a focus on how to hire for a data role within a club and how to embed that role within the club’s high performance infrastructure (focus on building a strong relationship between the coaching staff and the analytics staff). There was also some great recommendations for data visualization strategy, with references to quotes and best practices from John Burn-Murdoch – who spoke later on in the conference. Worville compared his role with The Athletic to the role of an in-house analyst for a club.
“[At The Athletic] people don’t see you as the smartest person in the room. They know you are as fallible as everyone else who is working there. There is a balance between ideas that people know will work and ideas that people know will not. This is an important environment to have if you hope to use any sort of analytics within a club. You need to have one side that has the data and is fallible and could be wrong, and one side that is open to using data in the decision making process.” – Tom Worville
Check out Worville’s work for The Athletic here.
- Marcel Daum – Assistant Coach/Analysis, Bayer 04 Leverkusen
- Machine learning AI integrated within club
- Data available for players
- Putting data into practice
- Maurizio Sarri possession video
- “Passing for the sake of passing can lead to mistakes”
- We want to be dominant and brave, have confidence
- Possession play style changes over time
- Ball possession as part of our DNA in practice video
- 5 second rule
- Win the ball back within 5 seconds
- Can we press Bayern Munich?
- Noticing in the data that teams rarely high press against Bayern
- Half-half defensive positioning
- Sitting in between two offensive players and moving once ball is played
- Maurizio Sarri possession video
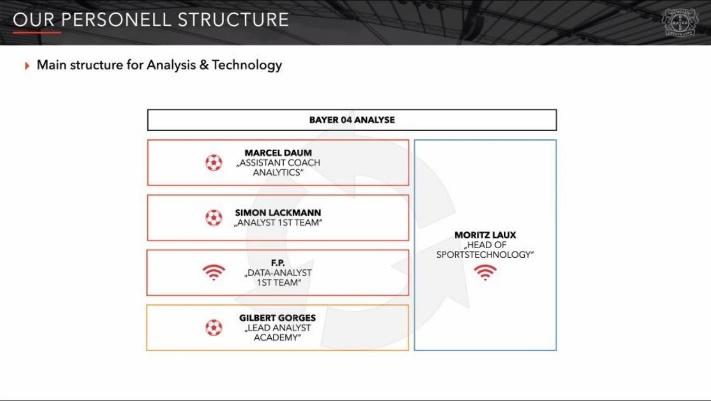
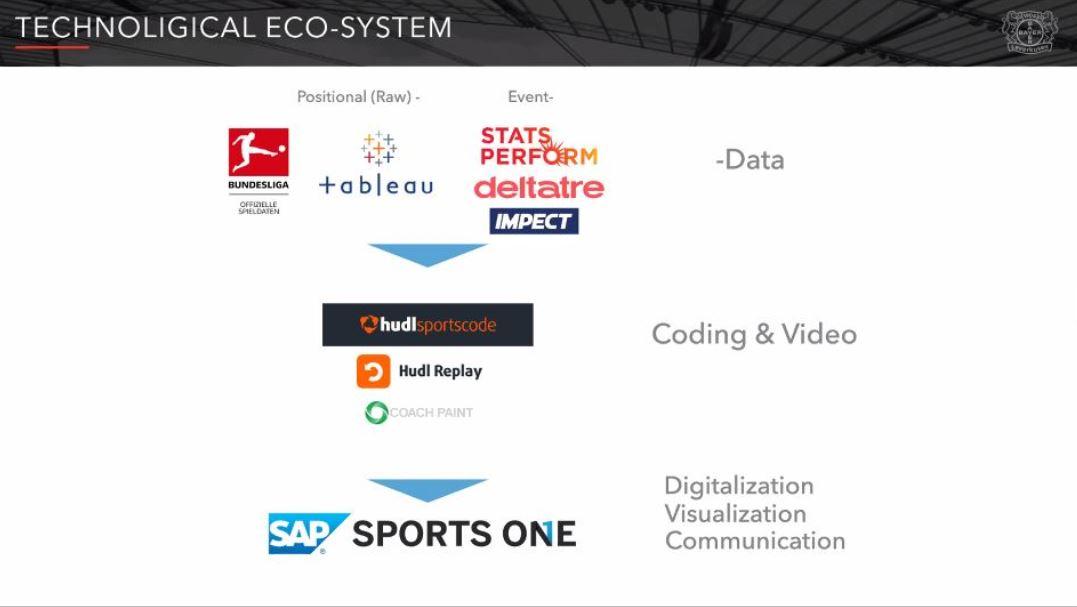
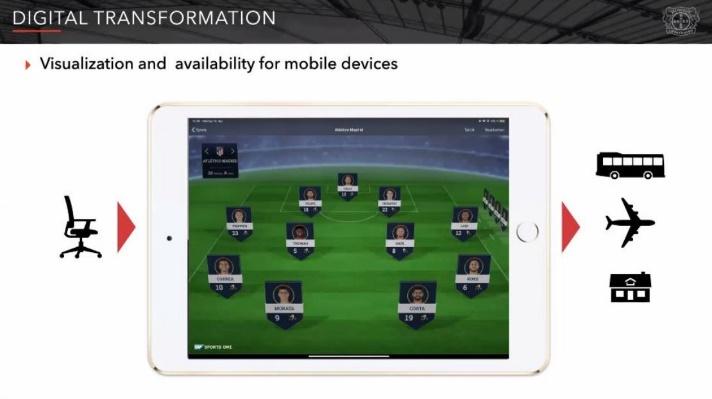
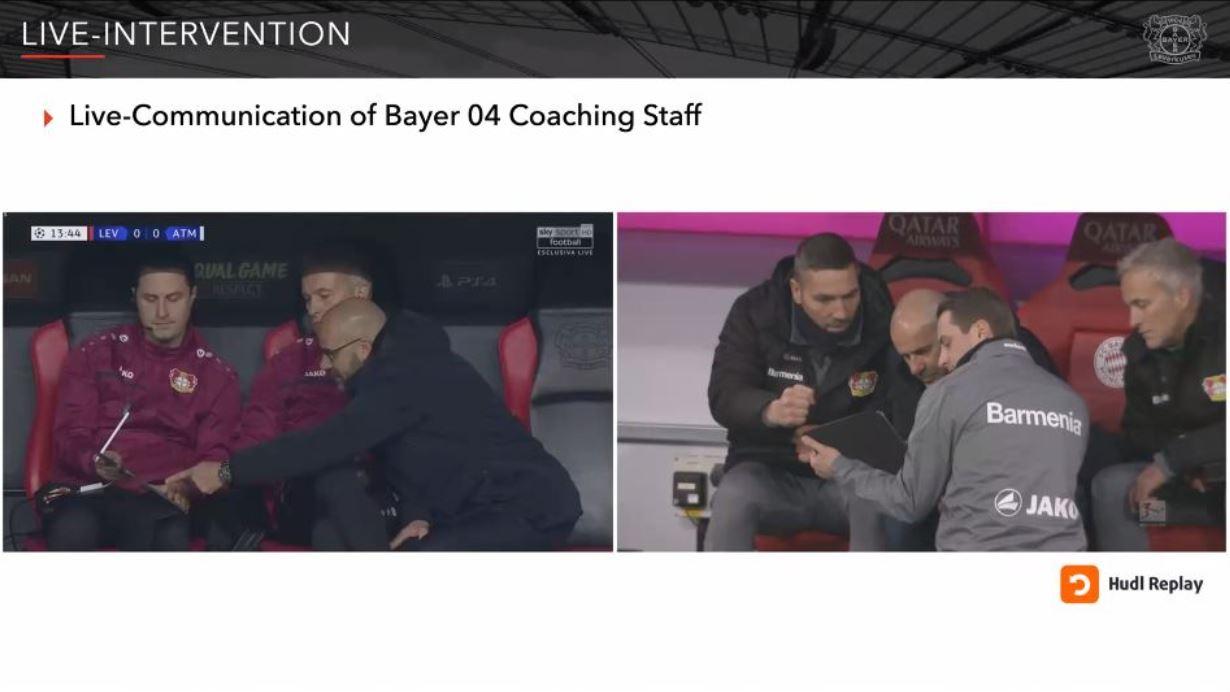
Summary: Daum gave a very thorough summary of how Bayer 04 use data to make decisions. There was a really great example of this when he talked about how the analytics team noticed in the data that teams rarely used a high press defensive tactic against Bayern. They relayed this information to the coaching staff and made progressive defensive shifts to try to disrupt Bayern. The Bayer 04 technological eco-system allows for players, coaches and analysts to input, manipulate and output data visualizations. These visuals are readily available in-game for coaches as they look to make strategic adjustments. Alongside performance analyst counterpart Simon Lackmann, Marcel relays information directly to the coaching staff during games.
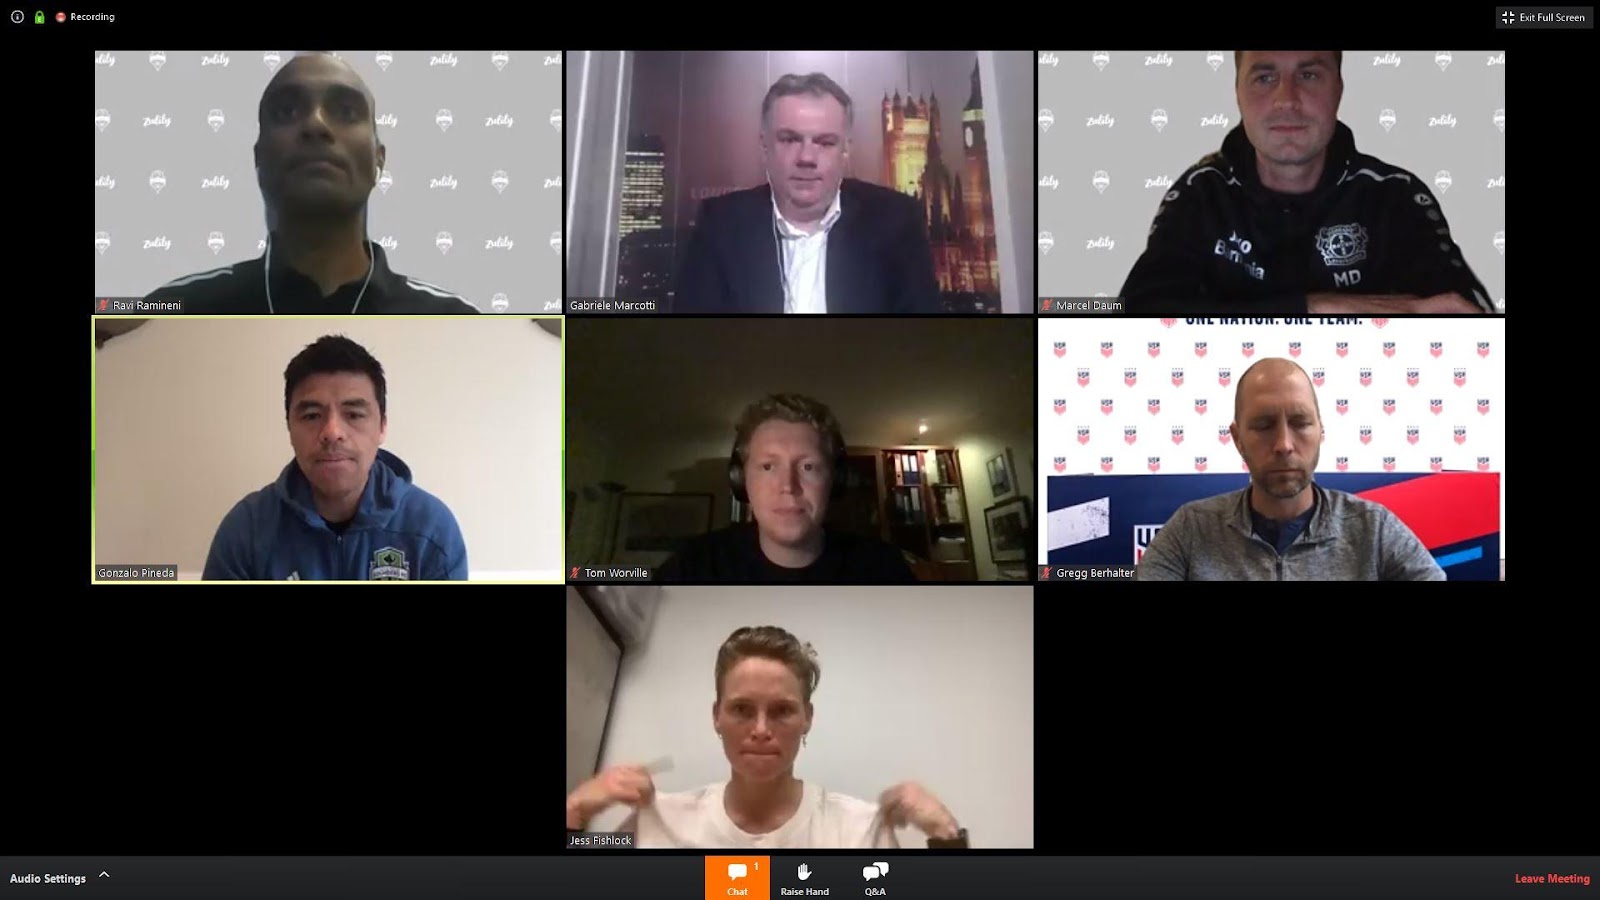
- Day 1 Panel
- Moderator
- Gabriele Marcotti @Marcotti – Senior Writer, ESPN
- Panelists
- Ravi Ramineni @analysefooty
- Jess Fishlock @Jessfishlock – Midfielder, OL Reign
- Gonzalo Pineda @GonzoPineda8 – Assistant Coach, Seattle Sounders FC
- Tom Worville @Worville – Football Analytics Writer, The Athletic
- Gregg Berhalter – Head Coach, US Men’s National Team
- Marcel Daum – Assistant Coach, Analysis, Bayer Leverkusen
- Question: How much data can be given to players and coaches?
- Pineda
- Unique in Mexico where statistical analysis is not as much of the culture
- Coaches’ ideas and philosophy should drive data usage
- Pineda
- Alan Pardew quote, “Enjoyed his time in Holland, but players wanted so much instruction” “Players should just get on with it”. Finding the right balance of instruction etc
- Daum
- Players coming through academy may be used to getting data and may be more likely to want to consume data
- Daum
- Coaches love data that backs up their thoughts – finding evidence to support your thesis
- Ravi
- Data should be used to cover each person’s blind spot
- Not data vs gut
- Ravi
- Q: Berhalter – How difficult was the transition from club to national team?
- Berhalter
- You don’t get the continual try, train, implement
- Pick certain phases of the game
- Efficiency of how you work
- Berhalter
- International soccer experience
- Methodology – Fishlock:
- You can be a team with the majority of players in few clubs
- Or give your same core national team group lots of time playing together
- If world cup is your main objective you can build cohesion over time
- Methodology – Fishlock:
- Q: Building cohesion at the national level – thinking in 2 and 4 year cycle creating guaranteed spots – trade off of playing all the time at a lower level vs being at a top club and playing minimally
- Fishlock
- Players playing at the highest level of the professional level carries into cohesion at the national level
- Finding clubs where players can get playing time another option
- Once everyone comes together at the national level, need to get everyone up to the same level
- Can’t ignore the fact that there are different levels of ability in the group
- Fishlock
- Coaching differences – what is the role as a veteran player to help players where the coaching isn’t reaching them as easily?
- Fishlock
- Different coaches provide for different role as a vet
- Some coaches welcome questions and some don’t
- My job as a vet is to feel the level of buy in and identify and guide the younger player’s process of understanding the coach’s wishes
- Pineda
- Approach of the coach is key in messaging to the leadership of the team
- Berhalter
- Coaching changes based on individual coaches
- We ask our players to create the dialogue
- Fishlock
- Moderator
DAY 2
- Joe Mulberry @joe_mulberry – Director of Recruitment, Right to Dream & FC Nordsjælland
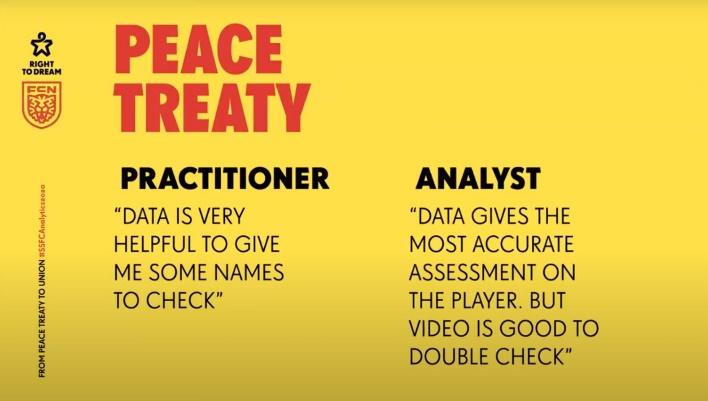
- From Peace Treaty to Union
- Right to Dream Academy
- Co-ed scholarships
- 80 students at one time
- Book recommendation
- Thinking Fast and Slow
- By Daniel Kahneman
- Intuition isn’t king?
- We are all riddled with biases
- By Daniel Kahneman
- Thinking Fast and Slow
- Learning journey
- Ghost twitter account
- Opta Pro Forum presenter x2
- Here today
- Move from peace treaty to a union
- How can analysts and practitioners become more collaborative?
- Intuition – Right to Dream Academy scouting
- Watching children in Ghana
- 35,000 kids assessed
- 4,000 games in the community
- Deep prolonged observations
- Formed via lived experiences
- A marvel for beginners
- Inexperienced football watcher compared to inexperienced reader
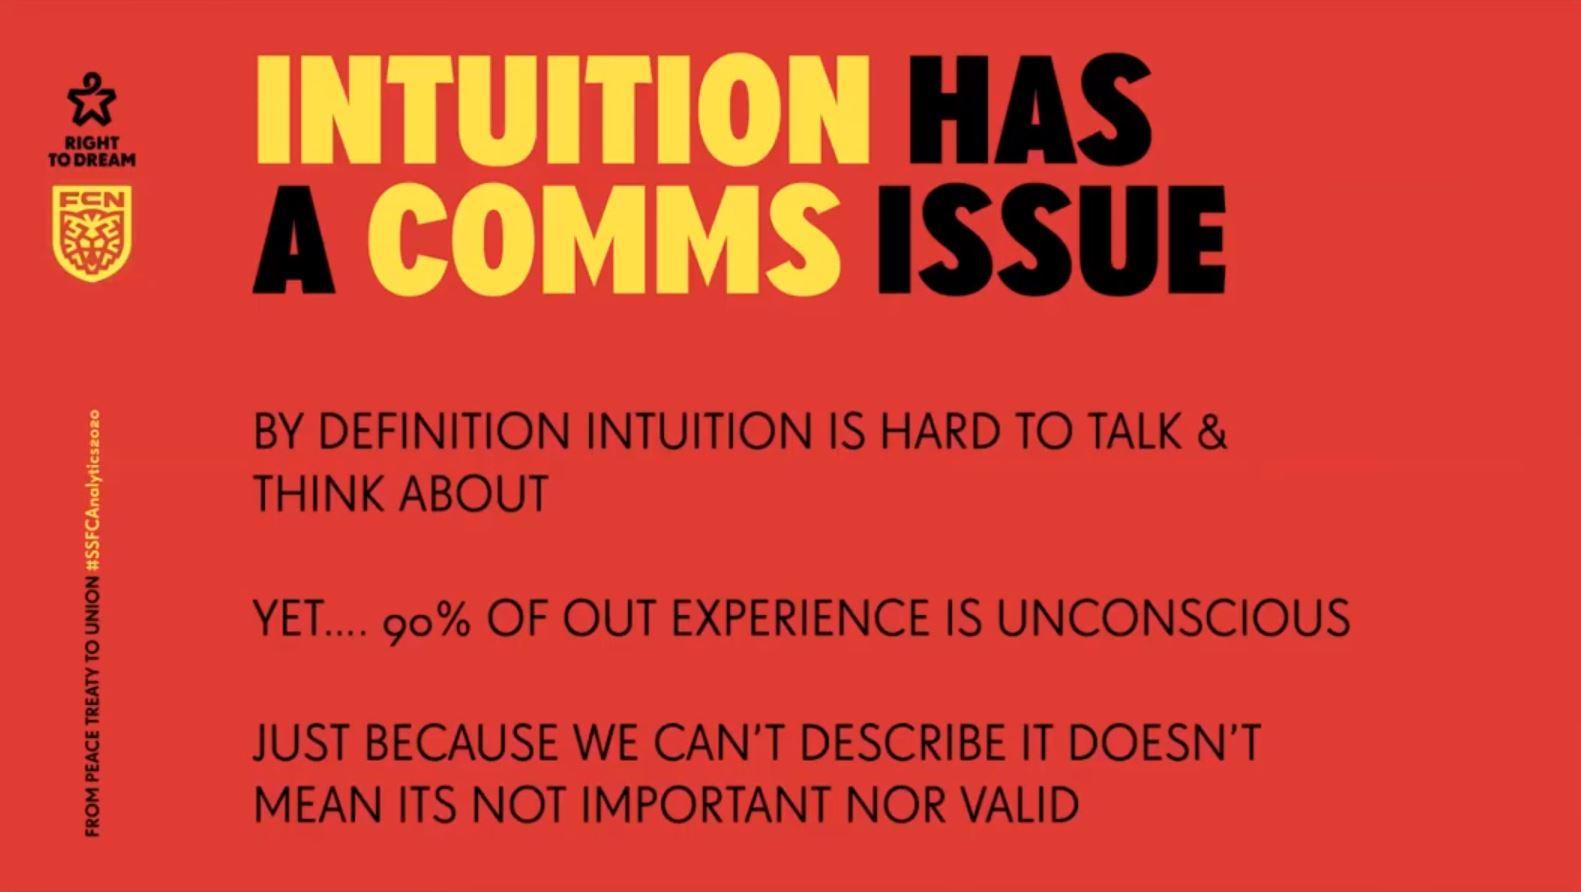
- A comms (communication) issue
- By definition intuition is hard to talk and think about
- Yet… 90% of our experience is unconscious
- Just because we can’t describe it doesn’t mean it’s not important nor valid
- Difficulties
- Answers are abstract
- What is a player seeing?
- What information is a player picking up from the pitch?
- Answers are abstract
- Watching children in Ghana
- Learn to question
- Be vulnerable
- Tough with a competitive job market
- Don’t pretend to know
- No barriers to new knowledge
- Often new understanding comes from destroying pre-existing knowledge
- What does FC Nordsjaelland look for in a player profile?
- Internal audit first
- What are our position needs?
- Finding a player that fits our style
- Watching video to see how a player copes with information
- Internal audit first
- How tough did you find your coding journey?
- It’s somewhat hard to learn, but there’s loads of resources

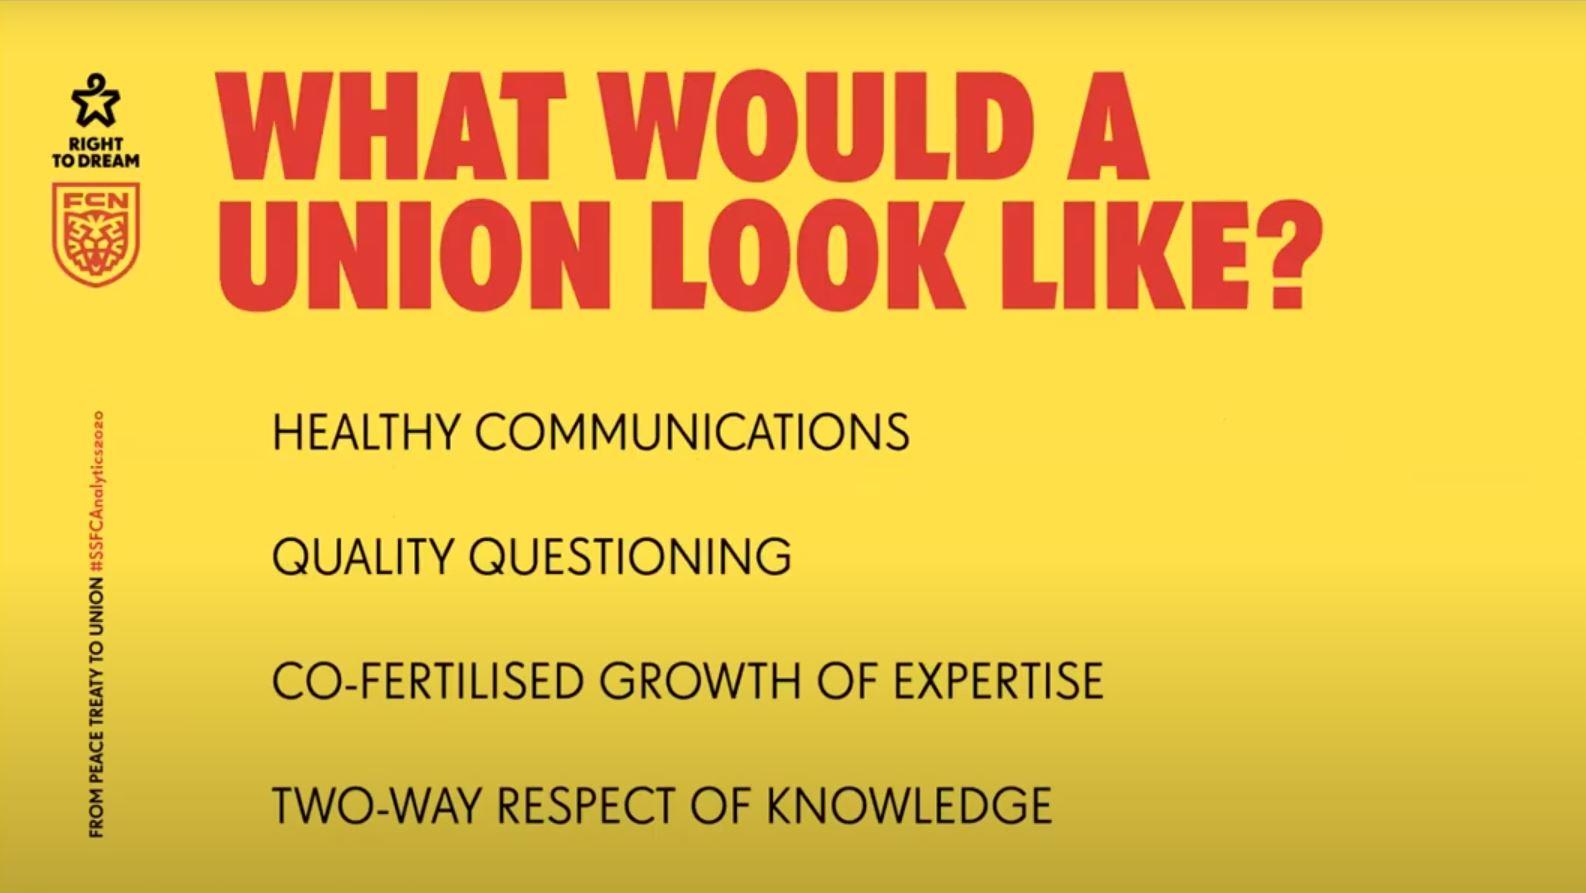
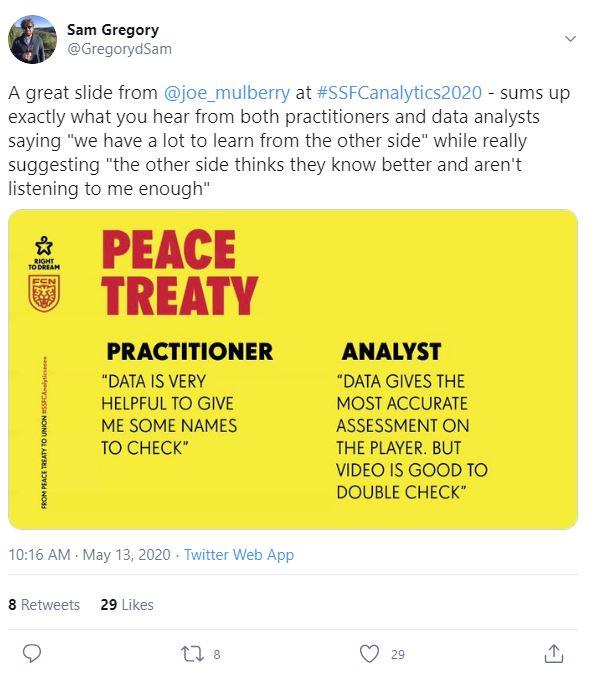
Summary: From peace treaty to union. Mulberry brought attendees through his analytics journey of learning to write code that prints “hello world” to making a wildly popular ghost twitter account that serves as an analytics resource to many (myself included), and finally to speaking at the Opta Pro Forum twice. Mulberry describes the current state of analyst and practitioner as a peace treaty. A movement towards a union between the two areas would lead to increasingly powerful insights for both sides of the equation. According to Mulberry, a union would look like: healthy communications, quality questioning, co-fertilized growth of expertise and two-way respect of knowledge.
There was lots of buzz on twitter about @Joe_Mulberry’s idea of the transition from a peace treaty to a union.
- Sudarshan “Suds” Gopaladesikan @DataStories2210 – Head of Sports Data Science, SL Benfica
- A player’s journey to Benfica
- Holistic performance
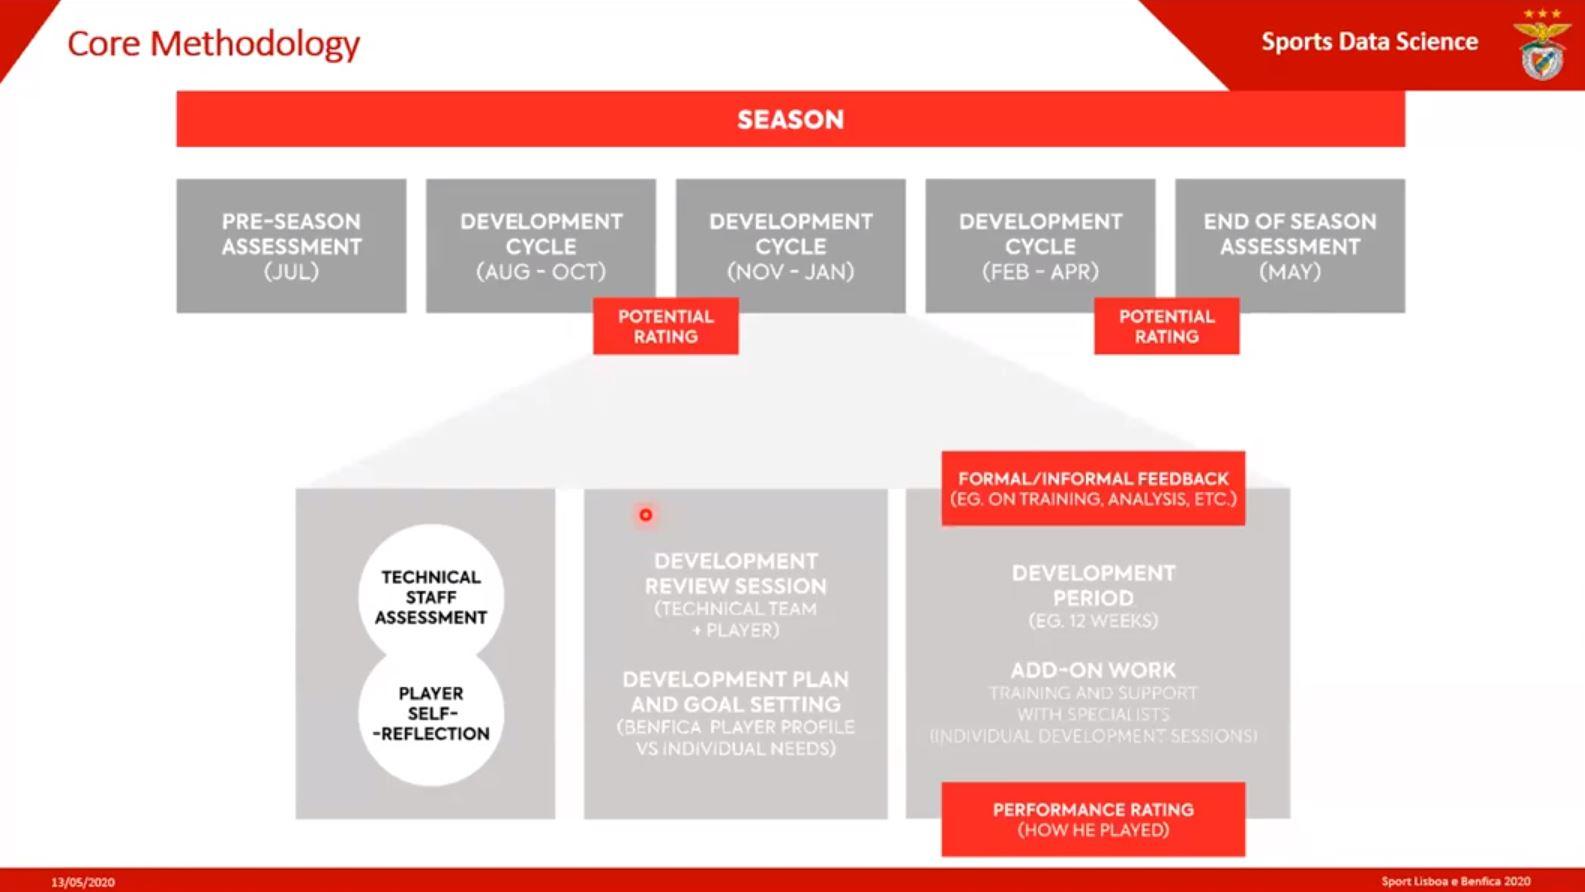
- Core methodology
- Data science goals for youth football
- Complements the work in creating a holistic intervention for our athletes so their development can reach their potential
- Value the work of everyone who supports our players
- Squad availability
- Which players consistently perform well during important matches?
- Are the players getting the minutes that they need for their development?
- Season performance report
- Flag for intervention
- Is the player ready to be promoted from a physical perspective?
- Acute fatigue response of 5 minutes of peak intensity
- Complements the work in creating a holistic intervention for our athletes so their development can reach their potential
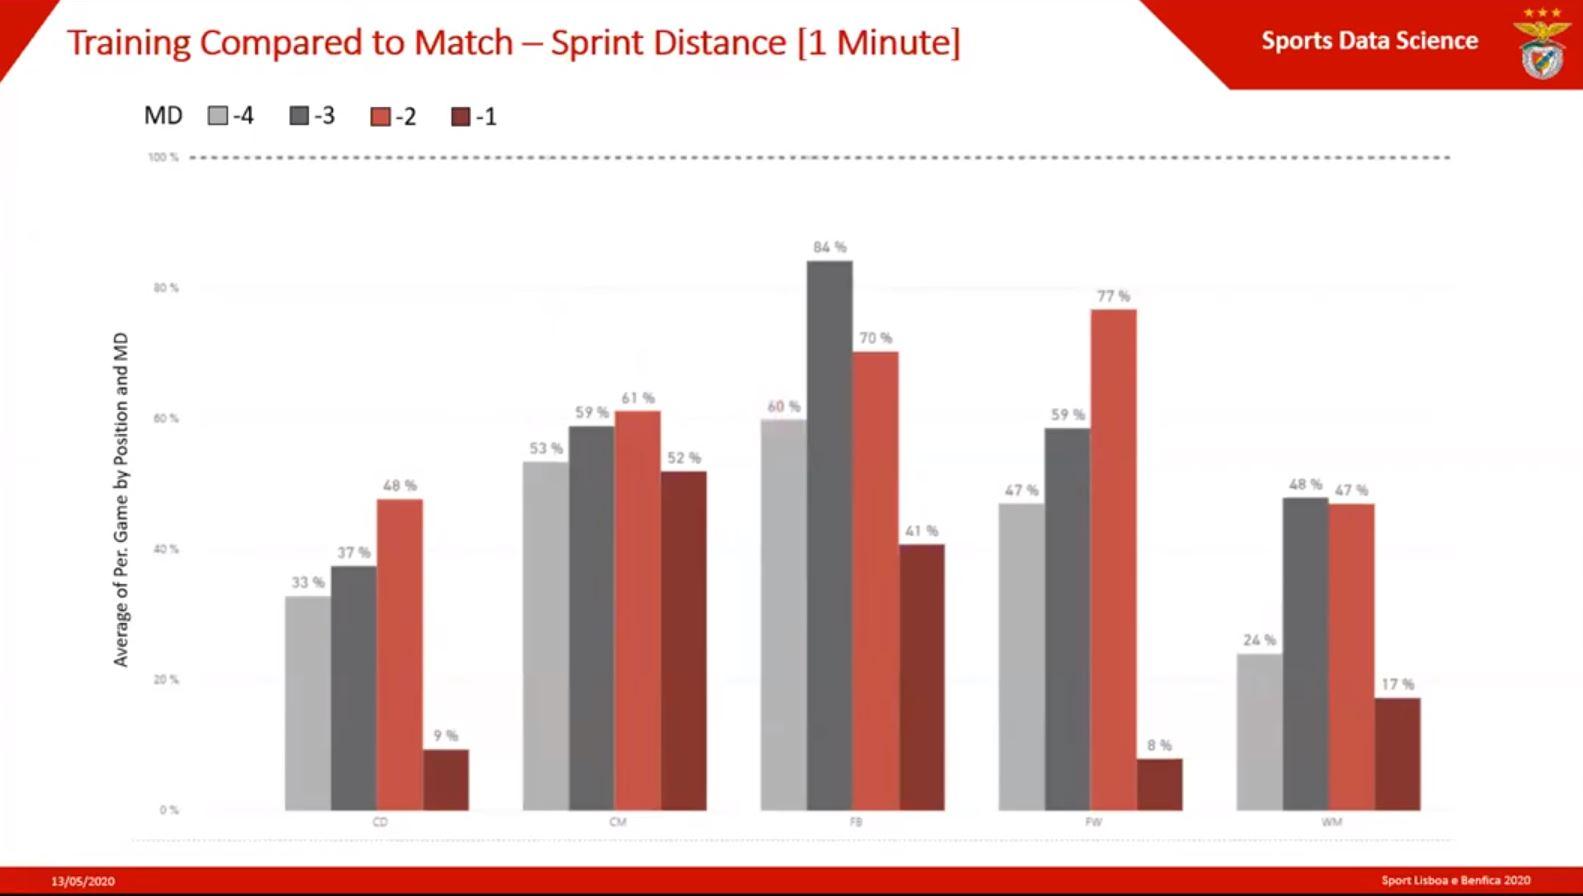
- Training comparted to a match
- Sprint distance
- SPI in context
- “Data analytics is the glue between video analyst and data scientist”
- Bio banding
- Understanding career trajectory
- Just because we can, does it mean we should?
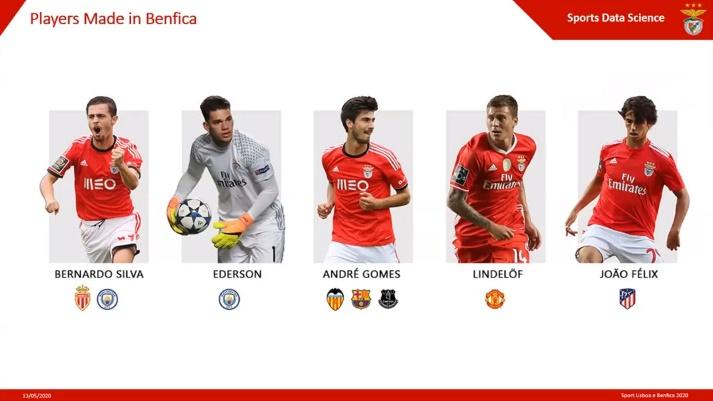
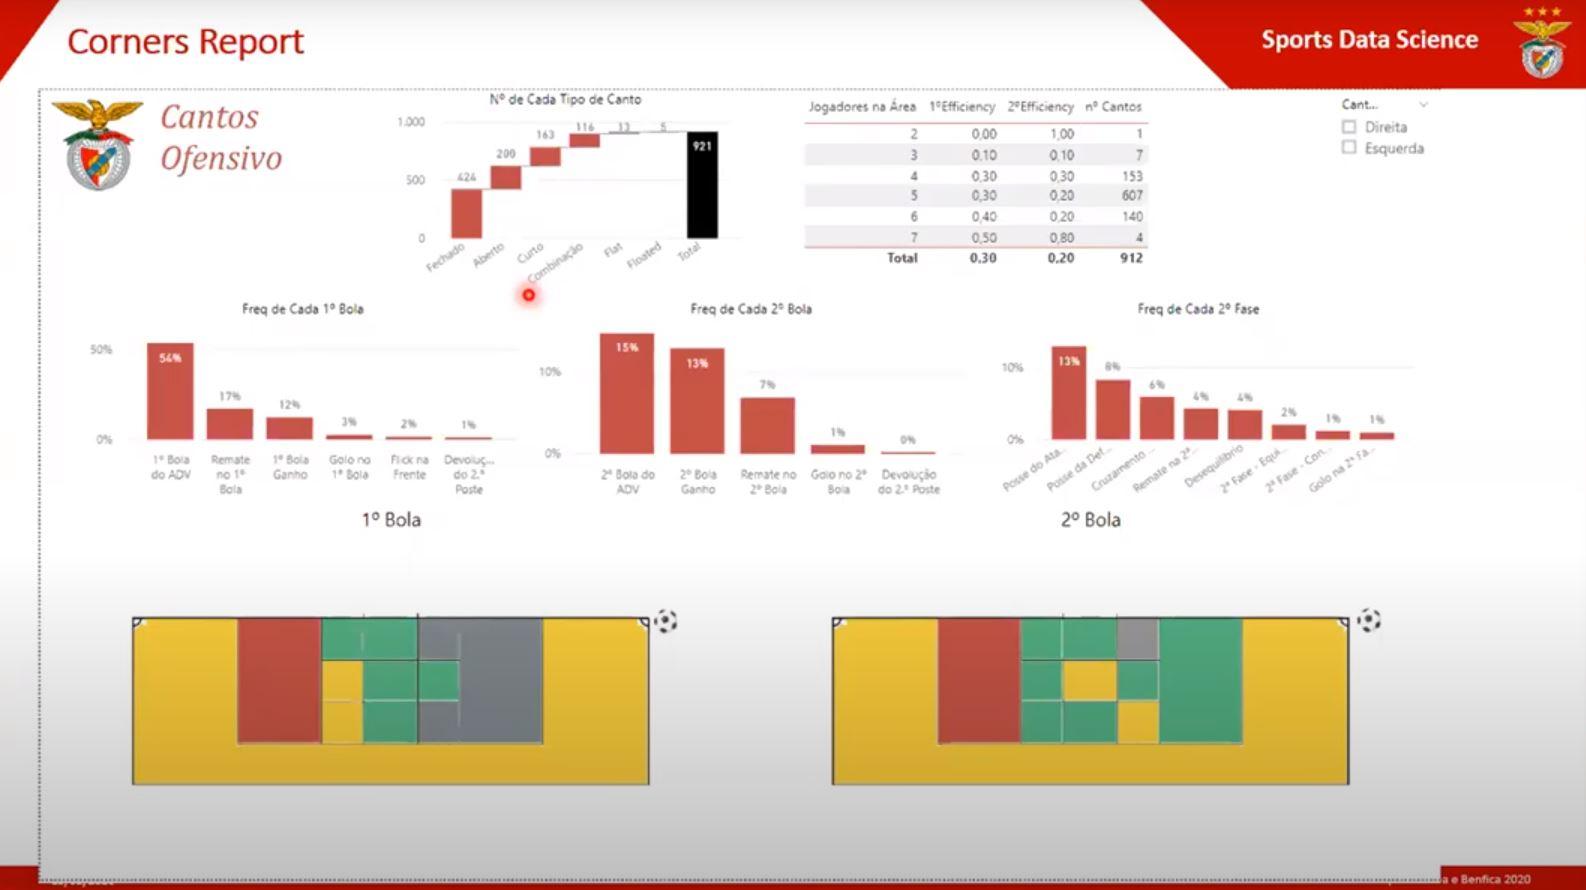
Summary: Context is key. As evidenced by the talent that has come through the Benfica academy, there is a commitment to youth development at SL Benfica. Taking a question like what is the efficacy of our corner kicks? Gopaldesikan walked participants through the Benfica process of looking at SportsCode data to structure the way they train defending and attacking corner kicks. Suds made a key distinction about how he and his team are not using data to say they need to start training near post corners, instead they are presenting the fact that they are not winning very many balls off corners at the near post. It’s up to the coaches to decide if they want to alter training based on this data. Be sure to check out Gopaldesikan on the Friends of Tracking youtube channel, which is a free resource that teaches participants how to use soccer tracking data.
“Data doesn’t settle the debate, but it helps inform the discourse that is being debated” – Sudarshan Gopaldesikan
- Karun Singh @Karun1710 – Software Engineer in Applied Artificial Intelligence
- Previous Work – Theme of creating data visualization with interactivity
- Sounders Analytics Presentation (as previous seen at Opta Pro Forum 2020)
- Applied research vs academic research
- Academic success – publications and citations
- Applied success – driven by value creation for end users
- Soccer
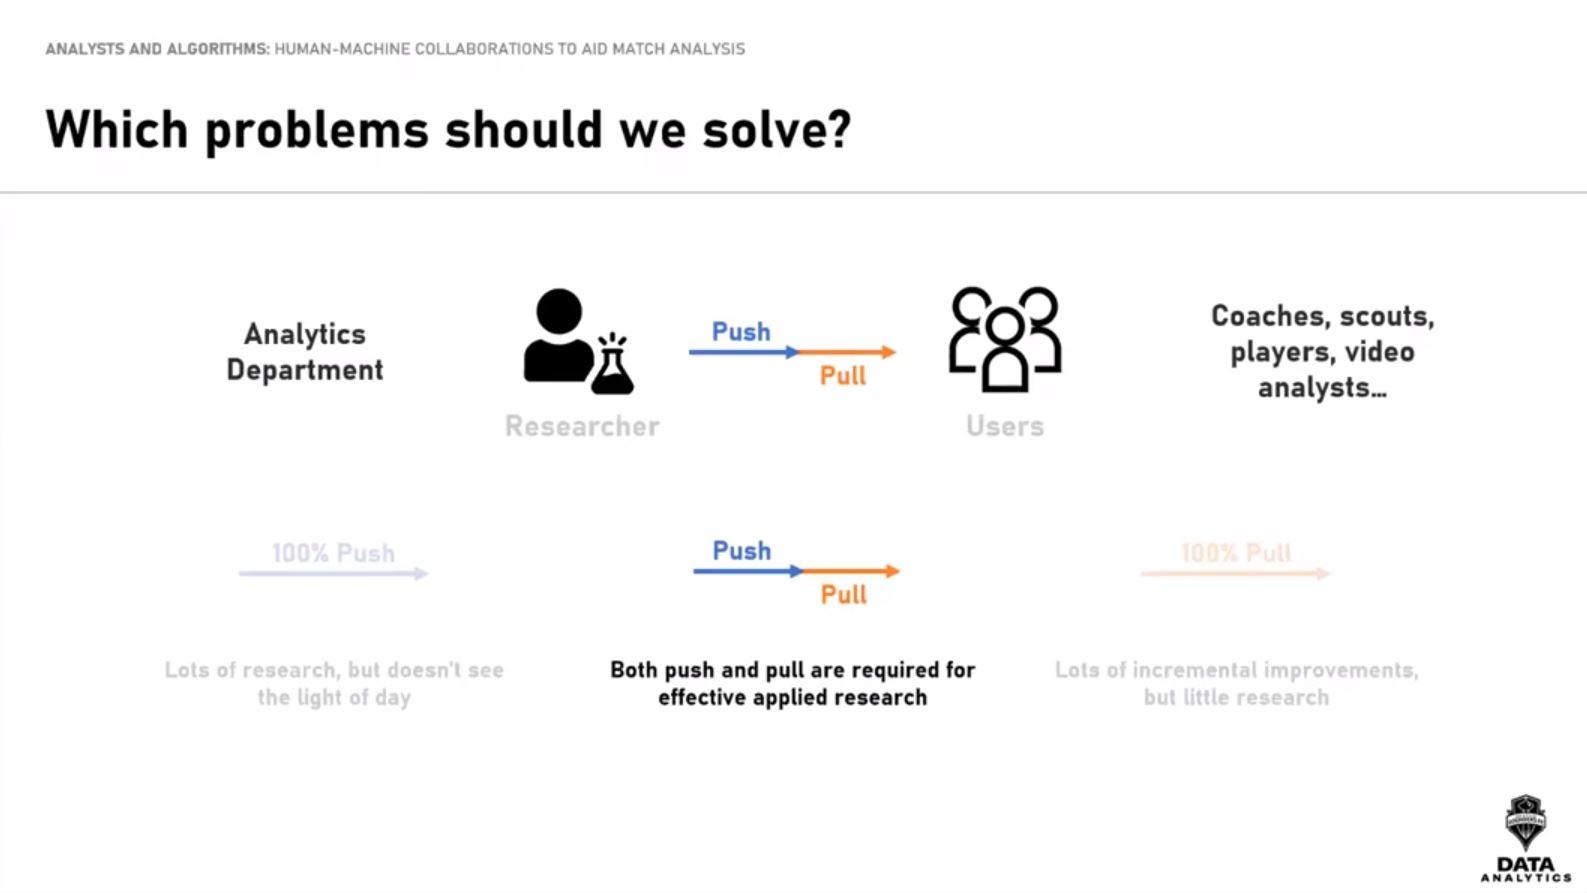
- Researcher = analytics department
- Users = coaches, scouts, players, video analysts
- Research decision making
- Macro-level – Which problems should we solve?
- Micro-level – How should we solve them?
- Soccer
- Video footage is central to match analysis
- Sifting through video is time-consuming and laborious
- How can we help accelerate video analysis?
- Combine the complementary strength of the video analyst domain expertise and the scalability of algorithms
- Current scenario
- Coach tasks video analyst with…
- “Find me other instances where something similar happened”
- “Tag all of Team X’s counter attacks”
- Coach tasks video analyst with…
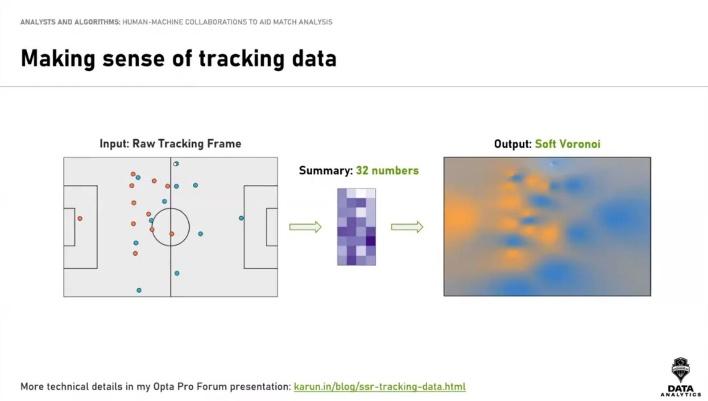
- Solution – making sense of tracking data
- Inefficiencies of voronoi diagrams
- Changes
- Adding a third region for the ball
- Create a soft voronoi
- Setting up a state machine to translate the input (raw tracking data) into the output (soft voronoi)
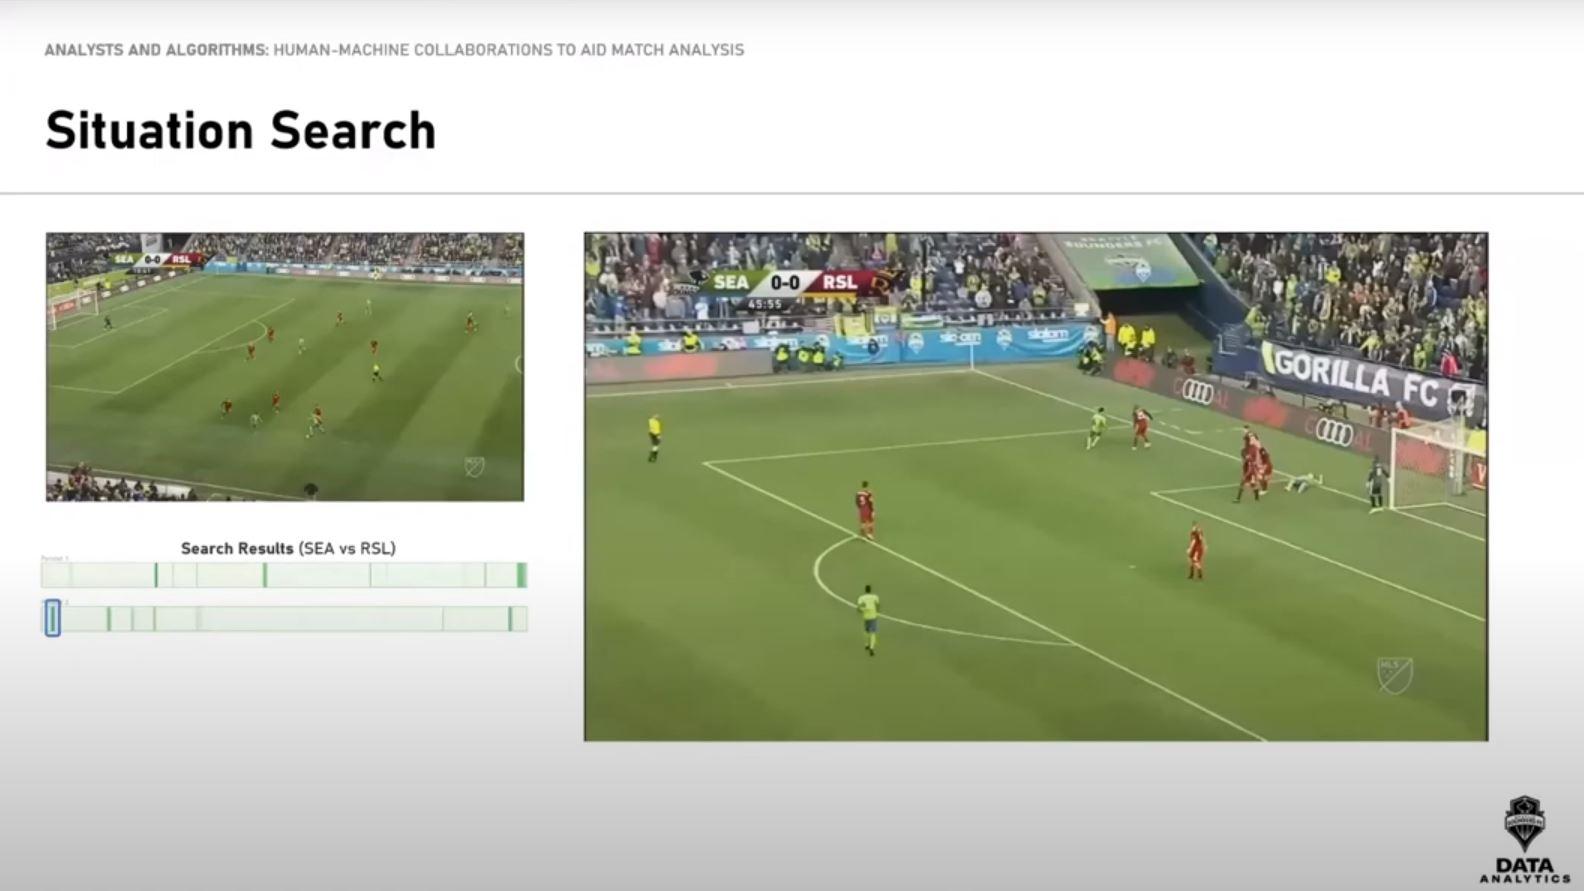
- Situation search
- All tracking sequences given a point in 32 dimensions
- Nearest neighbor search in the 32-dimensional space to find similar situations
- Tool to allow a video analyst the opportunity to easily find a similar passage of play over multiple matches
- Can be integrated into a tactic board where the user can move players around and find situations that mirror the movement
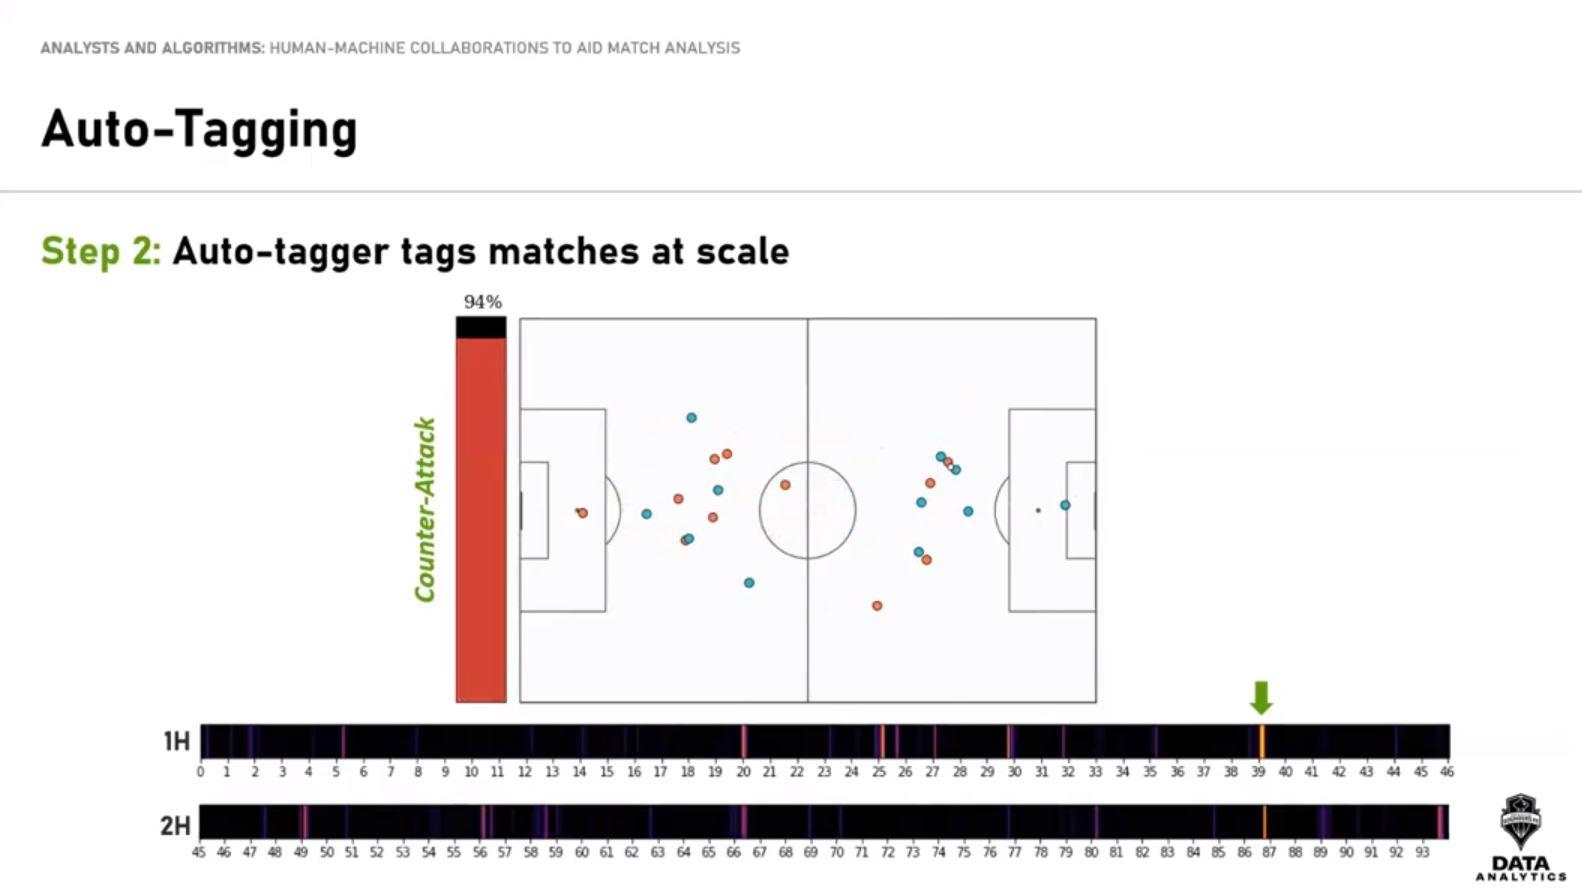
- Auto-tagging
- Crossing opportunities
- Step 1: Analyst teaches the auto-tagger what to look for
- Provide the machine with instances that are and are not crossing opportunities
- Step 2: Auto-tagger tags matches at scale (binary classification with logistic regression model used on 32 dimensional space)
- Step 1: Analyst teaches the auto-tagger what to look for
- Counter attacks
- Same steps as above, but more complex and manual tagging (teaching machine) takes slightly longer
- Can potentially lead to more false positives
- What can we learn?
- Machines take static snap shots of the game and struggle with deciphering ball possession, velocity, and ball height
- Humans and machines make different kinds of mistakes
- Humans excel at precision, machines at recall
- Crossing opportunities
- What’s next?
- Core improvements
- Incorporate velocities
- Take ball height into account
- Capture fine-grained detail
- Practical considerations
- Handle incomplete frames
- Important as more tracking data providers can create tracking data feeds off of broadcast footage
- Focused queries
- Handle incomplete frames
- Core improvements
Summary: Singh brought up many of the themes that are central to the state of soccer analytics. Humans on their own are not enough. Machines on their own are not enough. Luckily, both can work together to cover each other’s blind spots. There needs to be a departure from objective vs subjective or qualitative vs quantitative. Ultimately, the best output comes when machines and humans work together to excel in different areas. In order to succeed in his applied research, Singh hopes practitioners within clubs will continue to try to utilize the auto-tagging self-supervised algorithms presented here. To continue to progress the tool, the nuances and intricacies of in-house data analysis work needs to be threshed out by the practitioners themselves. Though not currently working for a club, Singh represents the type of quantitative analyst that is needed to continue to progress and push current boundaries and norms of soccer analytics. StatsBomb CEO Ted Knutson @mixedknuts said in the day 2 panel that his company, and many other sports performance data companies, are always on the lookout for this type of talent. The issue is, many other industries are competing for the same candidates. Whether Singh winds up embedded in a club or working for a data company, or continues his hobbyist soccer analytics work, his current and future contributions to the community are a key cog in the progression of soccer analytics.
“This project encourages the idea of human and machine collaboration. Humans on their own are not enough and machines on their own are not enough, but each have complementary strengths. Humans excel at precision while machines excel at recall.” – Karun Singh
- Francisco Javier Garcia Cabrera – Goalkeeper Coach, Ex – Arsenal, Sevilla, PSG, Swansea & RCD Espanyol
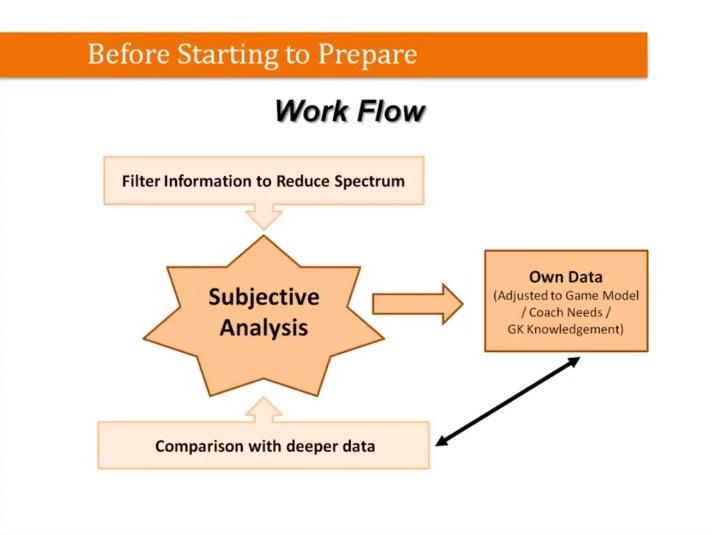
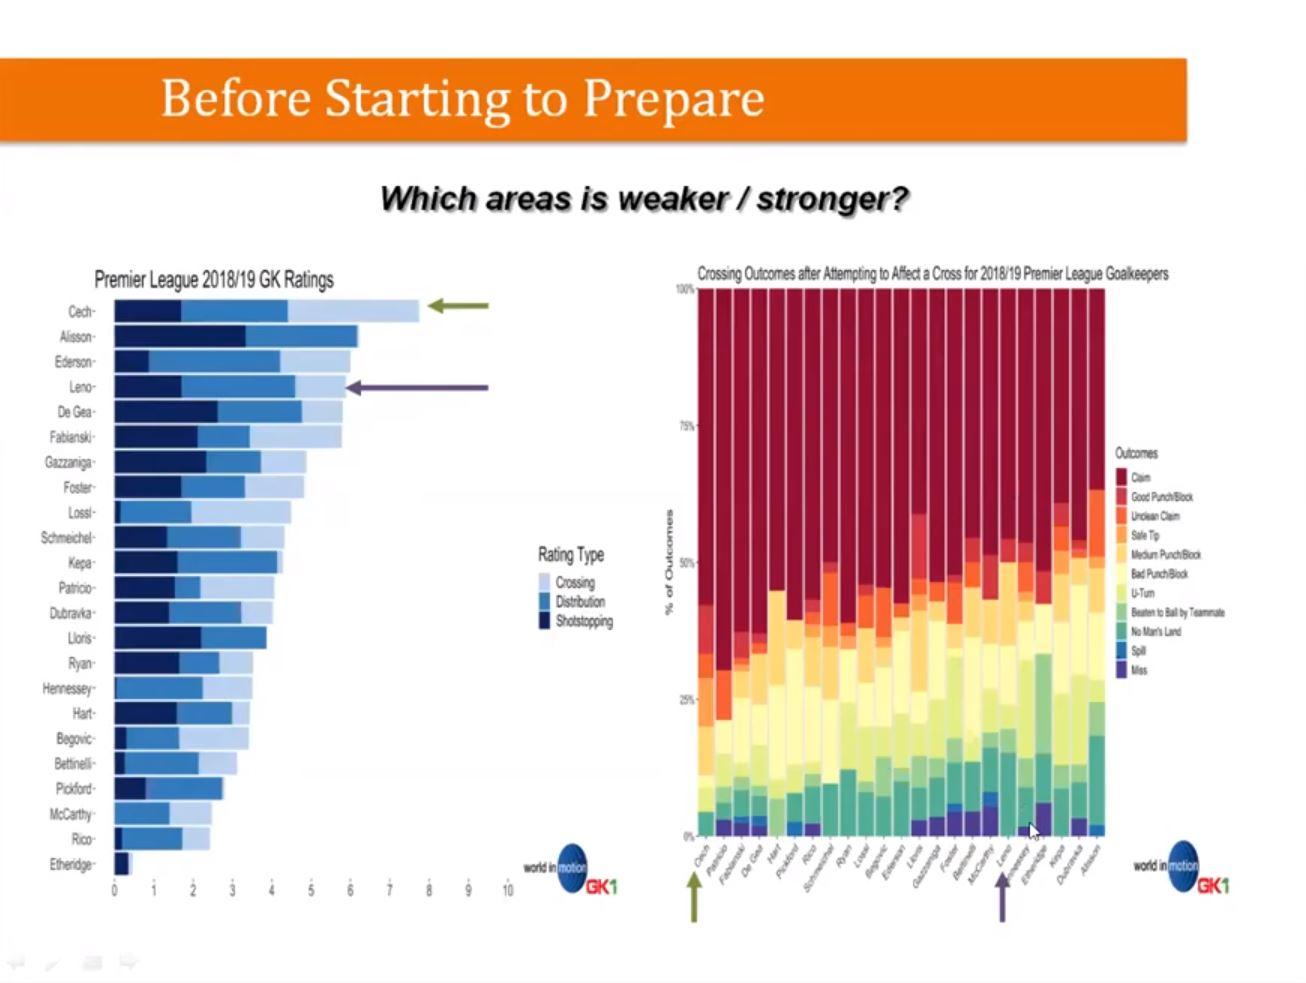
- Understanding how an opposing team attacks
- What players are most likely to attempt through balls?
- Low cross, aerial cross
- Opposing keeper goal kick distance
- Summary
- Offensive characteristics
- Set pieces
- Post-match
- Self-reflection
- Understanding how an opposing team attacks
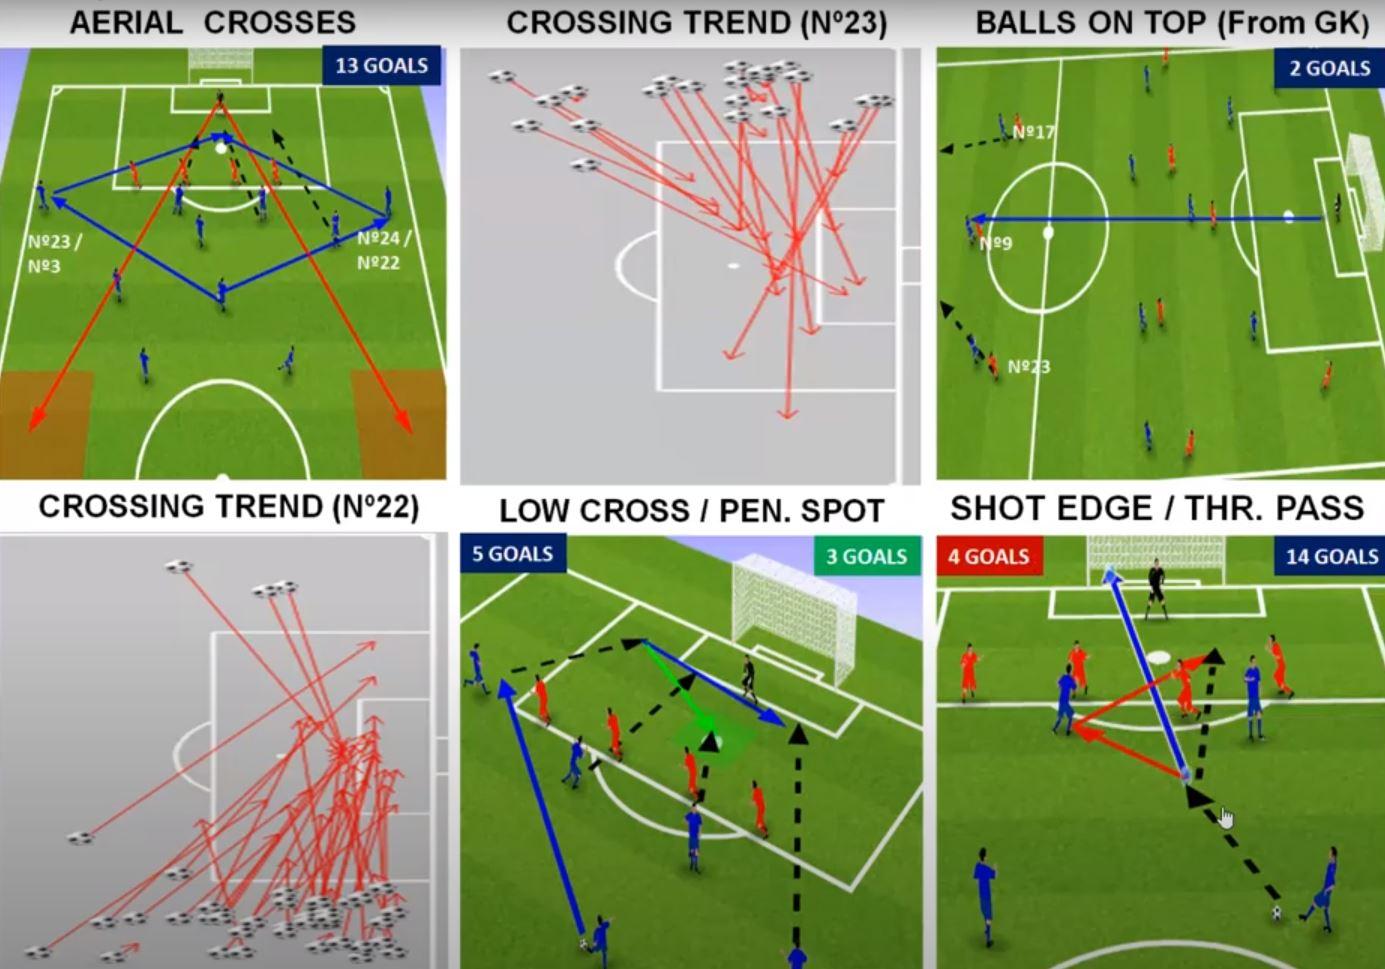
Summary: Garcia is very unique in the fact that he actually used to code games himself before quality event data existed. This talk was extremely interesting as Garcia went in-depth into all of the preparation that goes into goalkeeper training. This includes opposition team and individual analysis. For team analysis, Garcia breaks down opposition offensive style, specifically looking at what pattern of play has led to the most goals for the team in the past. Garcia looks into individual player tendencies, focusing on passing and shooting. Something as specific as cross type (low, driven etc) go into each opposition analysis session.
“[This preparation] allows the keeper to find where he needs to focus to fill space, and how he can best organize his defensive line,” – Francisco Javier Garcia Cabrera
- Panel discussion
- Moderator
- Sarah Rudd @srudd_ok – VP of Software and Analytics, Arsenal FC
- Panelists
- Javi Garcia – Goalkeeper Coach, Ex – Arsenal, Sevilla, PSG, Swansea & RCD Espanyol
- Ben Falk @bencfalk – Owner, Cleaning the Glass @cleaningtheglass
- Gary Lewis – Academy Director, Seattle Sounders FC
- Ted Knutson @mixedknuts – Co-founder, CEO of StatsBomb
- Joe Mulberry @joe_mulberry – Director of Recruitment, Right to Dream & FC Nordsjælland
- Sudashan Gopaladisikan @DataStories2210 – Head of Sports Data Science, SL Benfica
- Fast forwarding past event level data into tracking data
- Depends on the type of question you are trying to answer
- Compared to NBA where tracking data is all private and overall analysis is slowed because each team is reproducing similar work in silos
- Working in and out of the team and internally
- Speed and implementation changes when at a club
- Not just creating the solution, but how are we implementing the solution and spending time with stake holders to work through the requirements of implementation
- Team side is resource constrained
- On team side, we are trying to help the team as end goal
- A little pulled all over the place
- Juggling short-term on-field performance and analytics long term goals
- On team side, we are trying to help the team as end goal
- Speed and implementation changes when at a club
- Do clubs have the obligation to share anything publicly, balancing strategic insights they have found?
- Onus on clubs to guide the public sphere
- Guiding the focus areas to the public
- When clubs start hiring again the clubs will hire these people
- Friends of tracking referenced as a place for public to go and work with tracking data and learn how to apply it
- Onus on clubs to guide the public sphere
- Lack of consistent youth data as an issue for recruitment
- Gary
- Removing the bias to your own data
- Joe
- Using data and coaching insights to project a starting lineup 5 years in the future
- Doesn’t need to be performance data
- Ted
- Shortage of data
- Leads to data scientists being unsure of making conclusions
- Hesitancy of youth data based on confounding factors
- Shortage of data
- Gary
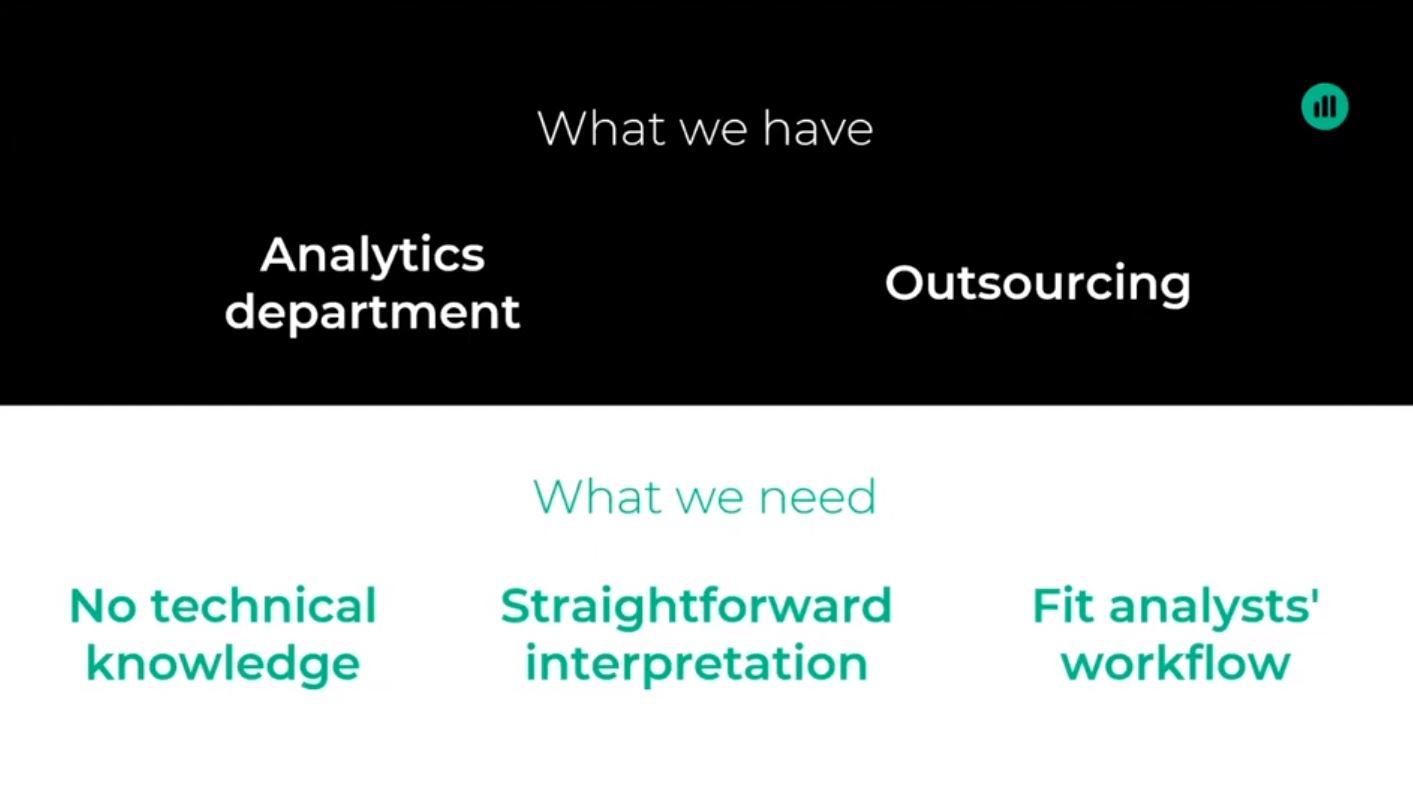
- What is the ideal set up for an in-house analytics department?
- Ability to create and use tools in-house
- Communicator – bridge between data and management
- Coach analyst role
- Money disparities of clubs
- Clubs that may need an edge may invest more in analytics
- Unconventional ways to succeed
- Next step
- Contextual event data
- Bridge between areas
- Contextual event data
- Moderator
Day 3
- John Burn-Murdoch @jburnmurdoch – Sr. Data Visualization Journalist, Financial Times, London
- Data visualization as communication
- Less of a technical science
- Death Chart guy
- Email from colleague sent Burn-Murdoch to get data about Italy
- Using logarithmic line not exponential
- Linear changes the narrative
- Non per cap
- Now we do a per cap it would change the narrative
- Huge response, really resonated with people
- Why has this really worked?
- Soft – communication aspect that set the chart apart
- Text
- Narrative title: Most Western countries are on the same coronavirus trajectory. Hong Kong and Singapore have managed to slow the spread
- Subheading: Cumulative number of cases, by number of days since 100th case
- Narrative title: Most Western countries are on the same coronavirus trajectory. Hong Kong and Singapore have managed to slow the spread
- Where do people look when they first encounter a chart?
- People first interact with the title
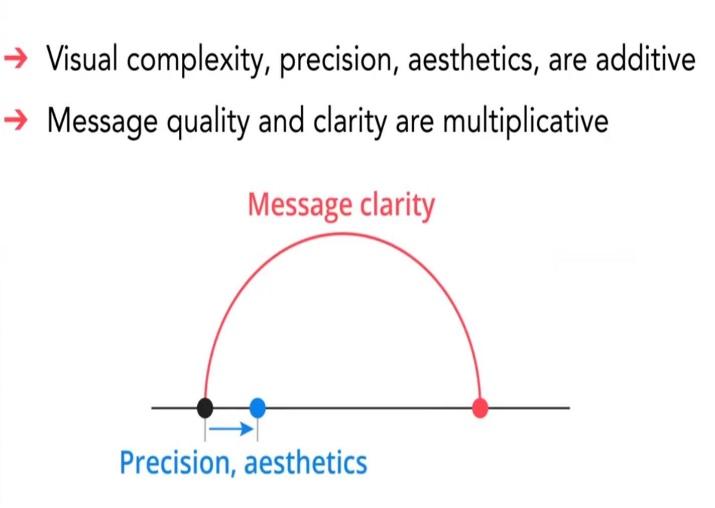
- Message > precision
- People take away a message from a graphical representation
- What is it that allows the person to look at the image and understand the trend/message?
- “You have to be like the worst tabloid newspaper in the front and the Academy of Science in the back”
- There’s a tendency to use a complex visualization for a complex analysis
- People first interact with the title
- Title
- Eliminates risk of someone not having an easy take away from the chart
- Focus on communication
- What is the target audience’s level of familiarity with different forms of data visualization?
- Human tendency to make graphics that show how good you are technically
- What is the target audience’s level of familiarity with the subject matter?
- Is there a captive audience, or will it appear in a crowded marketplace?
- What is our goal as practitioners of data visualization?
- Fundamentally about communication
- Everything else is secondary
- When your boss decides they don’t have time for the nerds or the art, you are in trouble
- Fundamentally about communication
- Questions about tools
- R ggplot for covid
- Then to python
- The best charts in the world can be made using excel or pen and paper
- R ggplot for covid
- Data visualization as communication
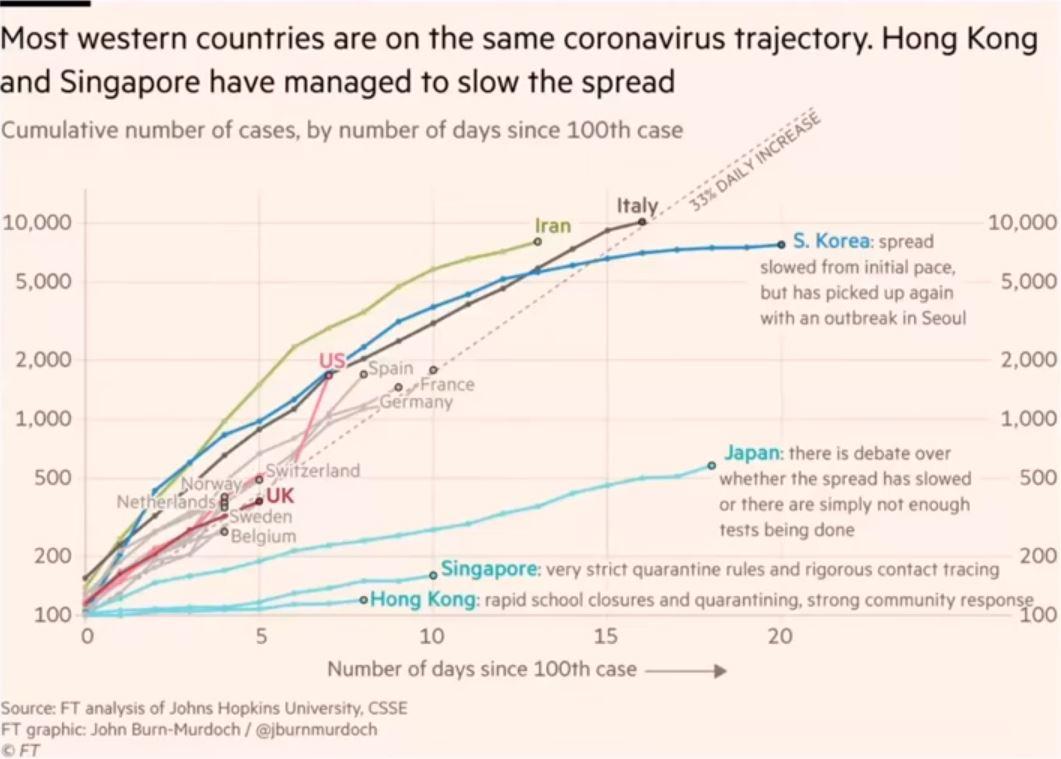
Summary: The Covid-19 visuals that Burn-Murdoch creates for The Financial Times have become very prominent as the virus moves throughout the world. These visuals have even led to a Burn-Murdoch’s new title: Death Charts Guy. Burn-Murdoch gave a distinct perspective on data visualization. He took participants through his visualization process, which includes a narrative title and descriptive text. The narrative itself, Burn-Murdoch says, is a huge reason why his Covid-19 charts have become so successful. That narrative title hits what the mood is at the time, which gives readers a reason to want to share the chart. The message itself allows people who feel strongly about it the opportunity to convey some belief of theirs. In turn, descriptive text also adds messaging that furthers the principle that the visual is trying to drive home.
“Data visualization is fundamentally an act of communication and getting a message across to people rather than a technical science.” – John Burn-Murdoch
“A chart made in Microsoft Paint is great as long as it communicates a clear message” – John Burn-Murdoch
- Billy Beane – Executive Vice President of Baseball Operations, Oakland Athletics
- Rory Smith @RorySmith – Chief Soccer Correspondent, New York Times
- European football unique and similar to US college football
- College fans can travel within SEC. This creates atmosphere
- Who were your contacts within soccer analytics?
- European football unique and similar to US college football
- Came to see a Tottenham game
- Conversation about salaries with both baseball and soccer people
- Noticed lots of similarities between baseball players and soccer players
- Moneyball became popular in the UK
- Conferences in Europe
- Acceptance of analytics within journalism
- Where is analytics applied within soccer?
- Transfer market at a much larger scale
- Valuing player performance properly
- Value that $1 more than your competitor
- Style of play
- No end to the use of data
- Premier League
- Big 6 clubs
- Star player from bottom 13 club wants to sell to top 6 club
- Getting into an auction – properly quantifying player ability
- Big 6 clubs
- At this point there’s not one club in baseball that doesn’t have some proprietary data analysis group in-house
- Combine brains and capital – things happen
- Where is the space for competitive edge? Doing something differently or doing something better than someone else?
- Baseball
- Analysts – One of the smartest industries in the world
- Competing with silicon valley
- Advantage in hiring because people will work for pennies on the dollar to be in sports
- Meritocracy, best and the brightest work here
- Changing of the guard – less playing backgrounds
- In the past executive team had all played the sport
- Defensive shifts impact all aspects of the game
- 20 extremely smart people in a room will accomplish things outside of baseball
- Baseball
- Chance for a smaller team to take advantage of post Covid-19 reality with transfer market?
- Everything will be relative
- Worst position you can be in is having to do something
- The strong businesses will be the clubs that will be able to take advantage
- Youth development
- Exposure to the best
- We already have it figured out in US women’s soccer
- Character is subjective
- What are your favorite and least favorite statistics in soccer?
- Corners
- Number of long crosses
- One could argue analytics makes sports less fun to watch
- My mentor Andy Ellerson
- Once the genie is out of the bottle with analytics publicly we can’t put it back in
- The world is becoming more data driven including sports, every field must adapt
- My mentor Andy Ellerson
Summary: This was a fantastic Q&A session between Rory Smith and Billy Beane. Beane, known for Moneyball (starring Brad Pitt as Billy Beane), was very candid with his interaction with data. Beane described the differences and similarities between baseball and soccer. Beane had a great anecdote about when he met Robbie Keane. Keane asked Beane how much a baseball player makes and was astounded by the figure that could be made by “hitting a little baseball.” Upon returning to the Oakland A’s clubhouse, Mark Kotsay, an A’s centerfielder, asked Beane how much soccer players made in Europe, and was equally astounded at how much could be made “just kicking a ball around.”
“Everyone is a data guy until it doesn’t back up their opinion.” – Billy Beane
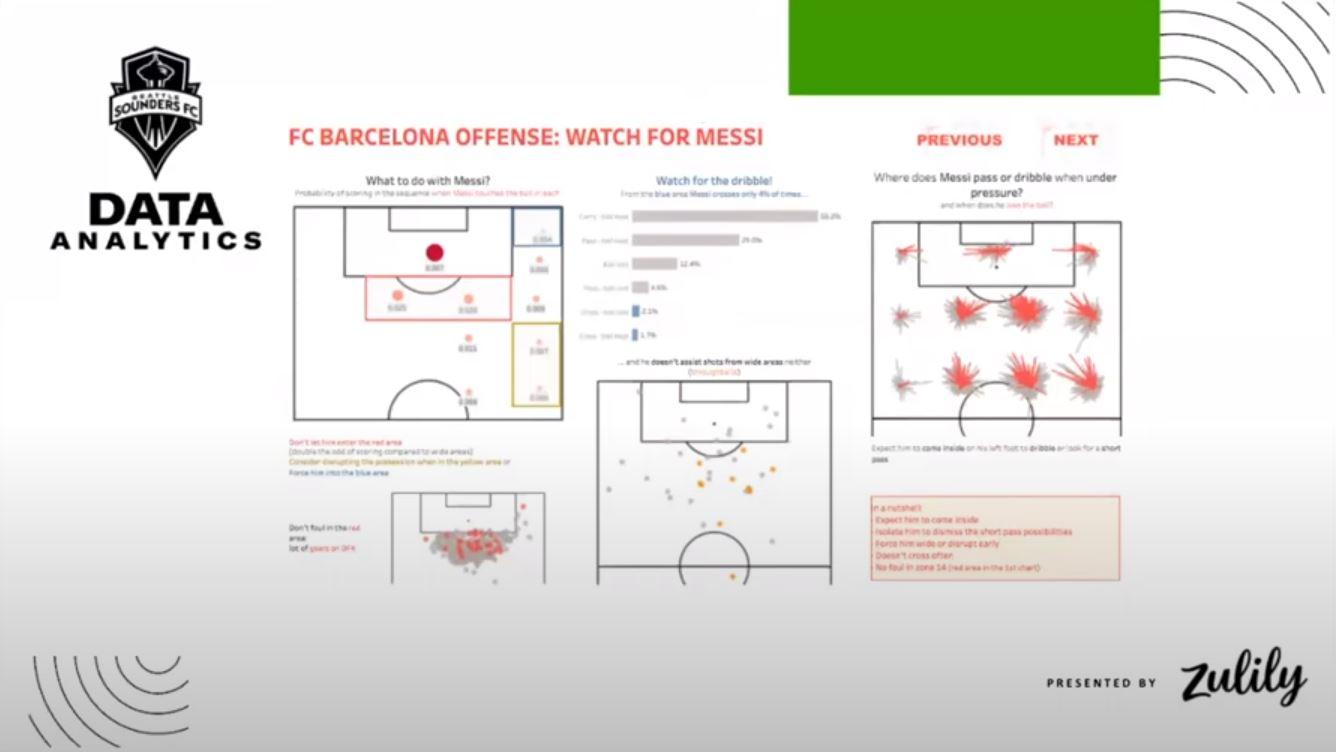
- Data Analytics Contest
- Judges
- Sam Gregory @GregorydSam – Data Analyst, SportLogiq
- Olly Downs @mathandporsches – VP, Data & Machine Learning
- Chris Anderson @soccerquant – Professor, European Institute and London School of Economics
- Judges
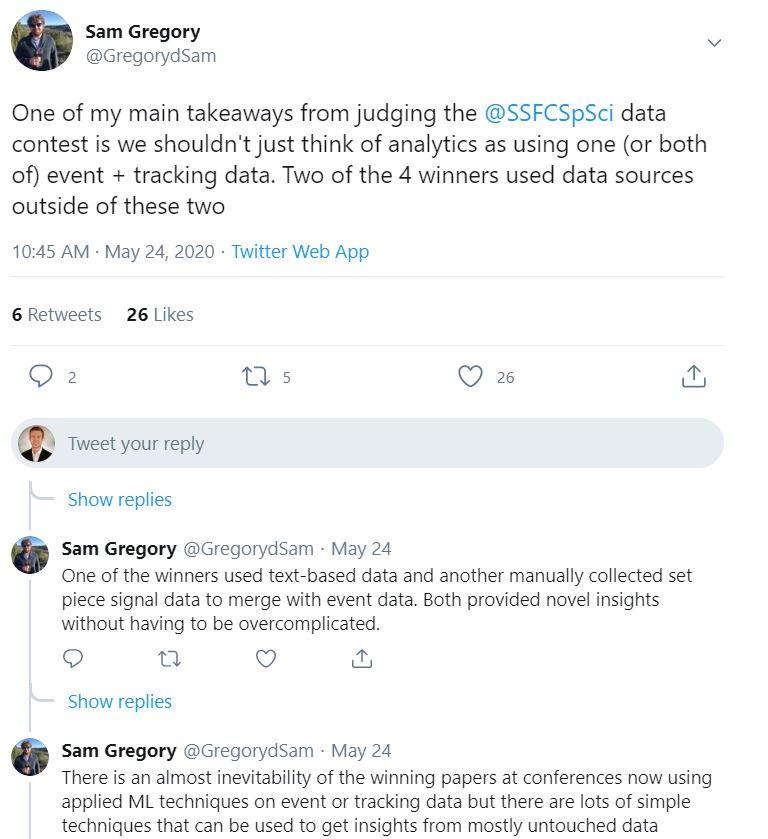
Check out what judge @GregorydSam had to say about judging the @SSFCSpSci Data Contest:
- Bruno Dagnino @brunodagnino – CTO, Metrica Sports @MetricaSports
- Empowered community
- Affordable data
- 10x more affordable than it is today
- Frictionless implementation
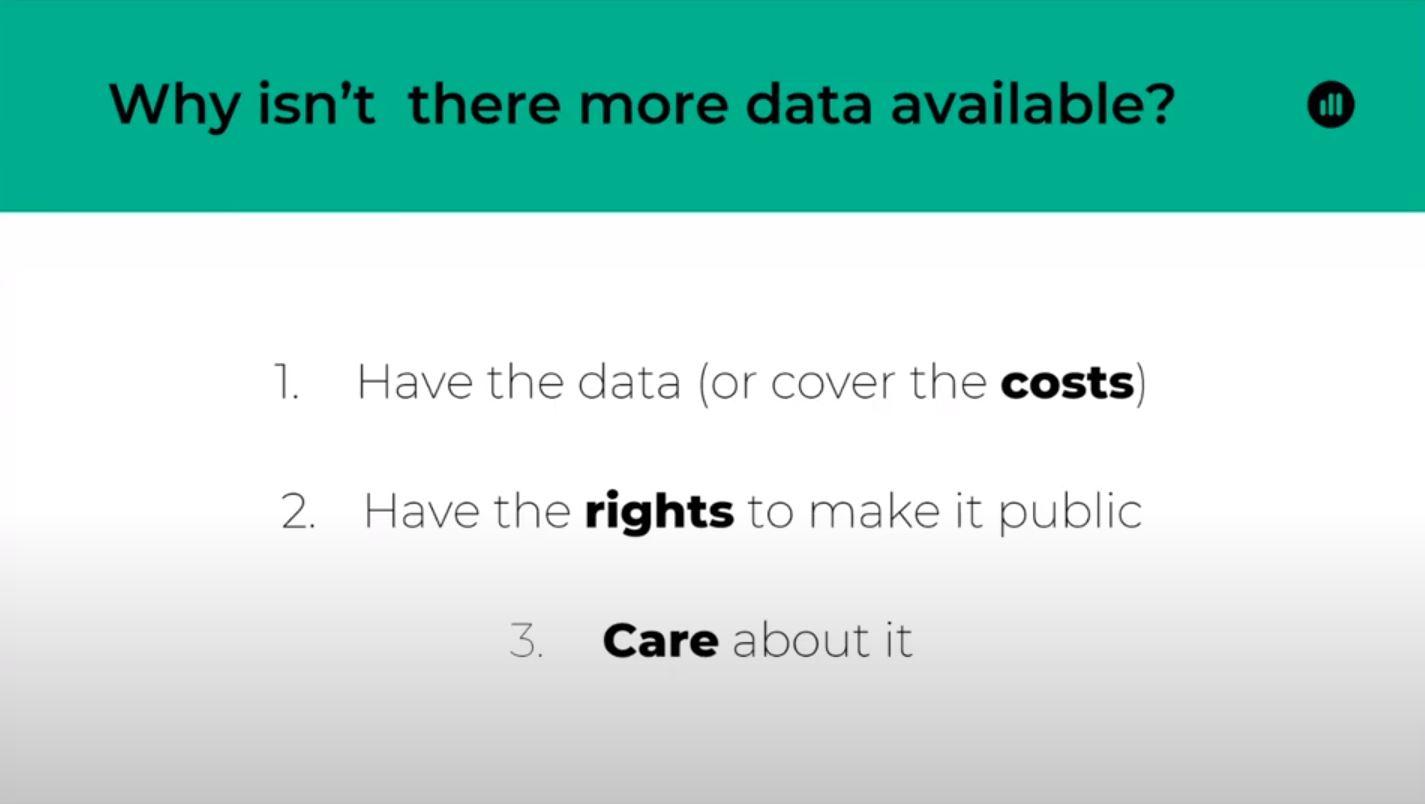
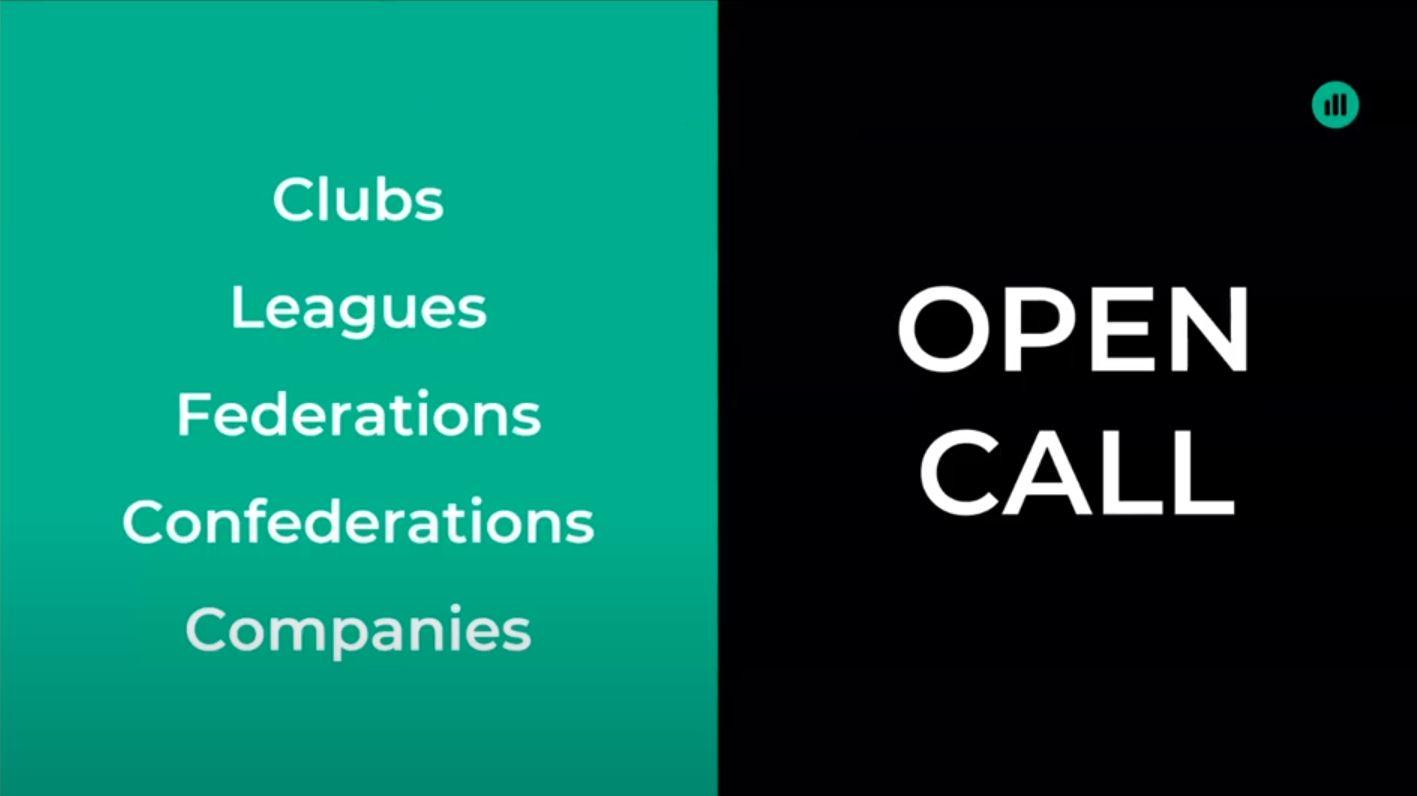
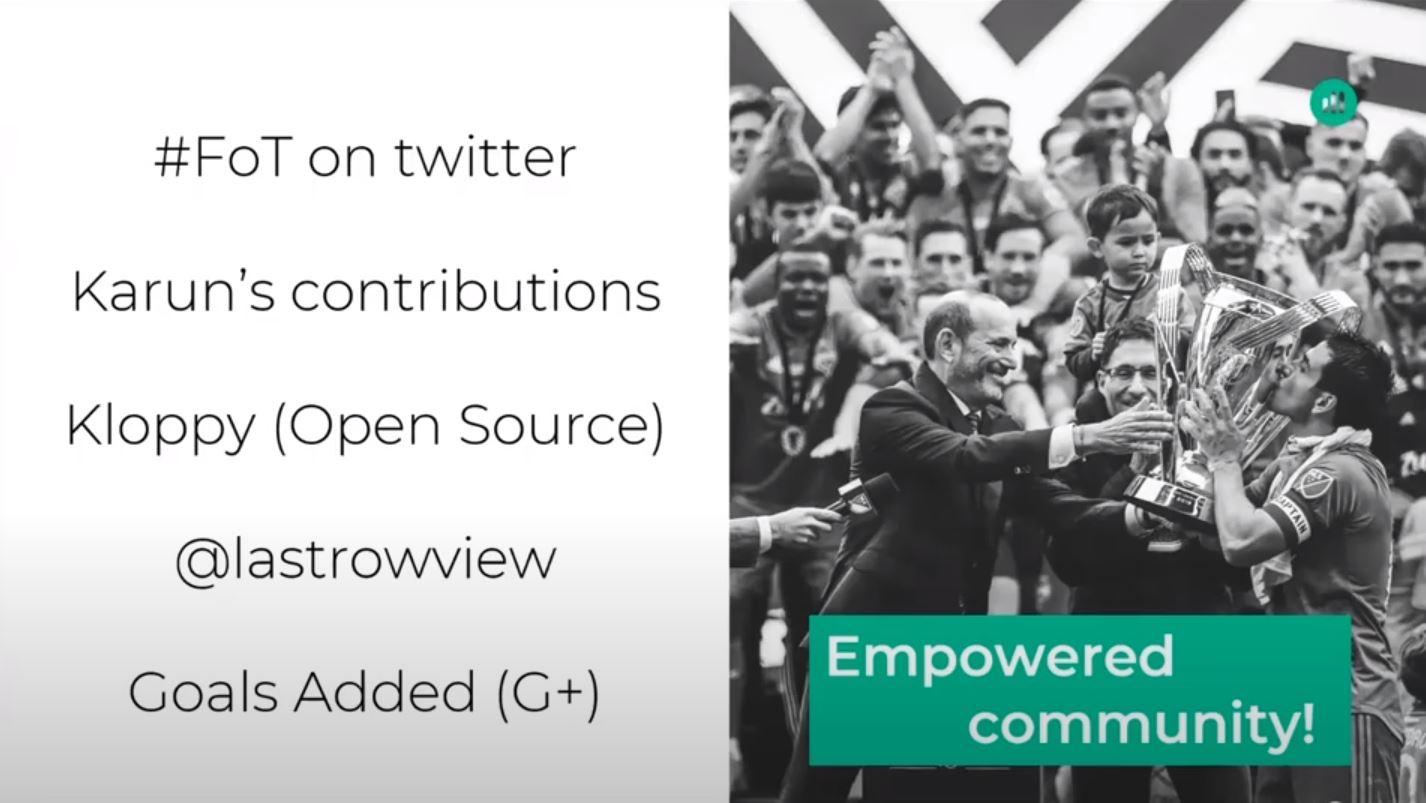
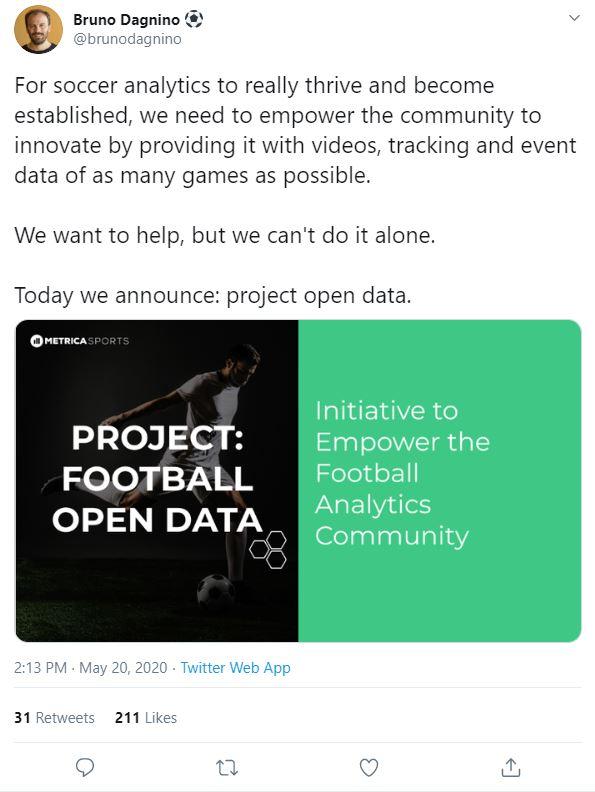
Summary: Dagnino focused his presentation on two key pillars of the progression of soccer analytics: empowering the analytics community and affordable data. A lot of the cost of producing quality data is the cost to correct the data. There are many companies, Metric Sports included, that have AI and machine learning algorithms that can watch a game and extract data. Though these algorithms have come a long way in the last few years, Dagnino showed an example of raw data as collected by a computer that had inaccuracies. The real cost, according to Dagnino, is the human element that must come in and spot check and correct data feeds. Dagnino said that with corrected data, advanced metrics, like Packing, which accounts for the number of players a pass or dribble beat, can be collected more accurately. Dagnino announced Metrica Sports’ Project Open Data. The project has two facets. First, Metric Sports has pledged to release 50 elite games and 500 non-corrected games, all complete with tracking and event data with video. The project also includes an open call to federations, leagues, clubs, confederations and other entities that have rights to make data and video public to release data to help the analytics community progress.
- Day 3 Panel
- Moderator
- Rory Smith @RorySmith – Chief Soccer Correspondent, New York Times
- Panelists
- Garth Lagerwey – President of Soccer, Seattle Sounders FC
- Bruno Dagnino @brunodagnino – CTO, Metrica Sports @MetricaSports
- Chris Anderson – Professor in Politics and Policy, London School of Economics
- Moderator
- Themes: Who can work in analytics, not necessarily having experience playing the sport
- Fresh perspective
- Agents getting more interested in data
- Road block of getting data into the broadcast. Embedding it in how we talk about the game
- Currently analysis is left for half time for the pundits
- Gary Neville for example
Thanks for reading and huge shout out to Ravi for putting this all together. Cheers!
Other write ups:
By Can Ülker @ulkerca
Leave a comment